Are the 1% of the 1% pulling politics in a conservative direction?
Graphics by Amy Cesal and Ben Chartoff

In the 2012 election 28 percent of all disclosed political contributions came from just 31,385 people. In a nation of 313.85 million, these donors represent the 1% of the 1%, an elite class that increasingly serves as the gatekeepers of public office in the United States.
The more conservative the Republican, the more dependent that Republican is likely to be on the nation’s biggest individual donors, a new Sunlight Foundation analysis of campaign finance data finds. By “biggest individual donors,” we are referring to a group we named “the 1% of the 1%” after the share of the U.S. population that they represent.
These wealthy donors may be pulling Republicans to the political right, acting as a force for a more polarized Congress. The polarizing effect for Democrats, meanwhile, is unclear. If anything, more liberal Democrats depend a little less on 1% of the 1% donors than conservative Democrats.
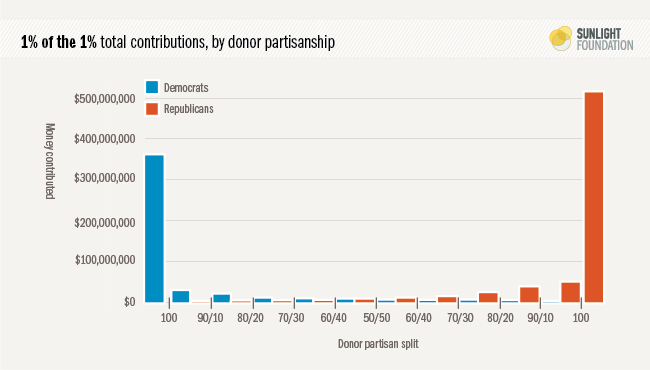
As we explored in our big-picture look at the 1% of the 1%, the biggest donors in American politics tend to give big sums of money because they want one party to win. Approximately 85 percent of the top individual donors in U.S. politics contributed at least 90 percent of their money to one party or the other. By contrast, less than four percent of these donors spread their money roughly equally between the two parties (a 60-40 split or less).
Figure 1.
The above figure treats all Democrats and Republicans as equivalent. In reality, both parties contain some moderates and some extremists. Some — Ezra Klein, most prominently — have argued that while small money exerts a polarizing tug on the parties, big money is consensus-oriented and centralizing. At the time, I responded that if big money was consensus-oriented, it was doing a terrible job of building consensus. I went further to hypothesize that big money might also be polarizing. Turns out I was more right than I knew then.
A closer look at the data
To start to make sense of the relationship between polarization and campaign funding sources, let’s begin with a look at the basic correlation between share of money coming from the 1% of the 1% and a common measure of polarization used among political scientists, DW-NOMINATE scores. The DW-NOMINATE model uses the voting records to arrange members of Congress on a scale of -1 (most liberal) to 1 (most conservative).
We limit ourselves here to House members who were re-elected in 2012 so we can use their DW-NOMINATE scores for the 112th Congress (vote-based scores do not yet exist for the 113th Congress).
Two scatterplots give us a general picture of two key relationships. Figure 2 is in line with our existing understanding that small donors tend to prefer more extreme candidates. For both parties, the more extreme the candidate, the more they depend on small donations (under $200).
Figure 2.
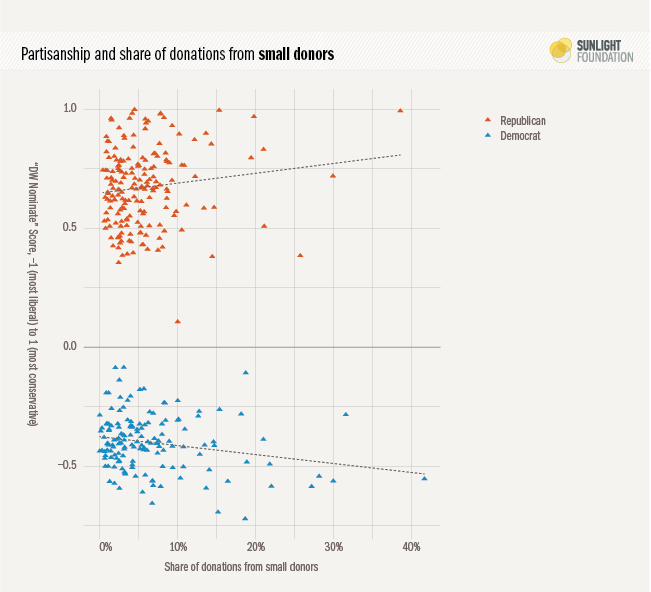
Figure 3 shows the relationship between polarization and 1% of the 1% dependence. Here, the correlations show that the more Republicans depend on 1% of the 1% donors, the more conservative they tend to be. There is no observable relationship among Democrats.
Figure 3.
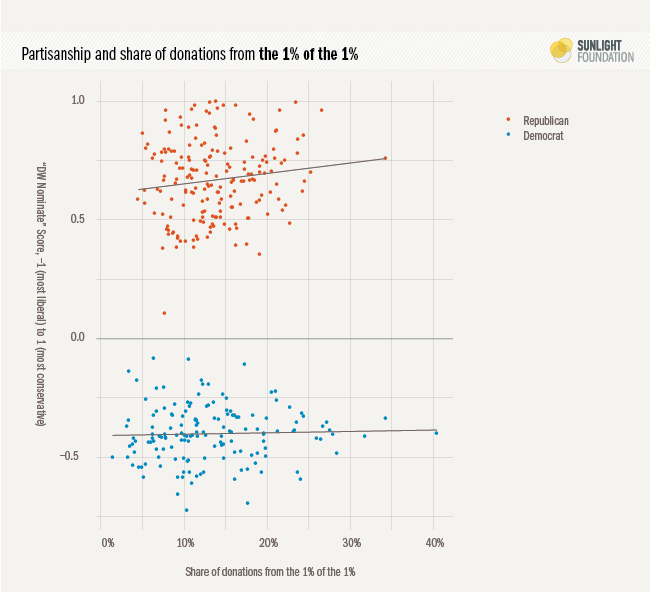
Figure 4 shows the relationship between extremism and 1% of the 1% dependence, but with a slight twist. Here, we break members of Congress into two groups – those with more than 10 percent of their money from small donors, and those with less than 10 percent of their money from small donors.
Figure 4.
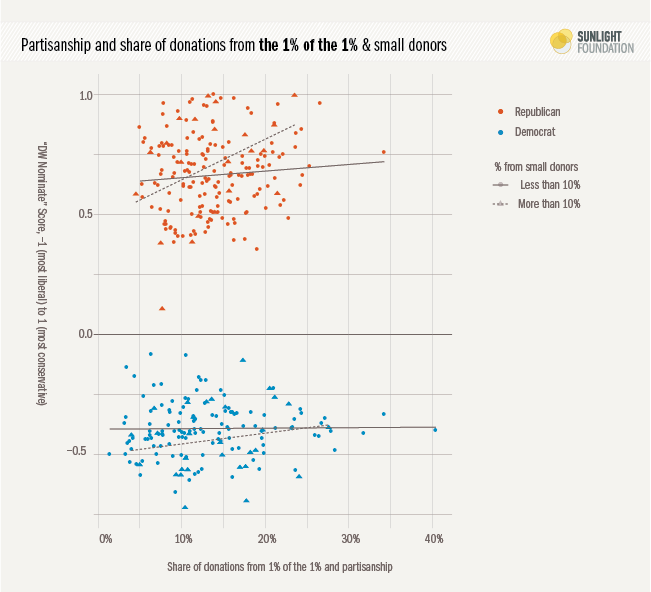
Let’s first look at the Republicans. The triangles represent those Republicans who get more than 10% of their money from small donors, and the dotted line represents the relationship between partisanship and money from 1% of the 1% donors. The varying slopes tell us that the relationship between 1% of the 1% dependence and conservatism is much stronger among Republicans with decent small donor support (more than 10%). In other words, small donors and 1% of the 1% Republicans have similar ideological preferences
Among Democrats, the opposite relationship prevails, though it is not as strong: Democratic 1% of the 1% donors and Democratic small donors have somewhat contrary preferences.
Of course, what we really want to do is measure the correlations of all these variables while holding all other variables constant. We also should control for the competitiveness of the seat, since more partisan districts tend to have more partisan representatives. Fortunately, linear regression allows us to do this. The results of the ordinary least squares (OLS)linear regression are reported below.
We estimate extremism (the absolute value of the DW-NOMINATE score, multiplied by 100 for ease of interpretation) as a function of the share of contributions coming both from small donors and 1% of the 1% donors. We also hold constant the safeness of the seat (as measured by the share of votes the candidate received in 2012). We estimate separate effects for all the variables by party, but include a dummy variable for party to reflect that Republicans on average have more extreme voting records than Democrats (and assume this is not a result of their campaign funding sources, but other factors). Our sample, again, is House members reelected in 2012
The regression table is represented below. The outcome variable is extremism, which ranges from 0-100. It is calculated by taking the absolute value of the DW-NOMINATE score and multiplying by 100. For non-stats geeks who want to understand what the below means, scroll down. An explanation will follow.
Table 1.
Regression results, model 1
| Estimate | Std. Error | t value | |
|---|---|---|---|
| (Intercept) | 31.1 | 3.48 | 8.95 | Is Republican | 23 | 5.26 | 4.38 |
| Is Democrat x share from small donors | 40.4 | 17.4 | 2.31 |
| Is Republican x share from small donors | 42.4 | 17.2 | 2.46 |
| Is Democrat x share from 1% of the 1% | -4.81 | 16.7 | -0.288 |
| Is Republican x share from 1% of the 1% | 57 | 21.1 | 2.7 |
| Is Democrat x margin | 17.3 | 4.95 | 3.49 |
| Is Republican x margin | 8.79 | 4.45 | 1.97 |
Adjusted R-squared = .50
Here are the main conclusions:
- More dependence on small donors is associated with more extremist voting in both parties, and the effect is pretty much the same for both parties. Controlling for other factors in the regression, going from the minimum to maximum value for share of donations from small donors (in our data, from 0 percent to 58 percent) predicts a shift of 23.4 points to the moderate end of the 0 to 100 extremism scale for Democrats, and an almost identical shift of 24.6 points to the extremist end of the 0 to 100 extremist scale for Republicans. This effect is statistically significant for both parties.
- More dependence on the 1% of the 1% is associated with more conservative Republicans but not Democrats. Going from the minimum to maximum value for share of donations from the 1% to 1% (in our data, from 1.4 percent to 40.4 percent) predicts a shift of 22.2 points to the extremist end of the 0 to 100 extremist scale for Republicans. This result is statistically significant. For Democrats, the effect is practically null.
- A safer seat is associated with more extremist voting patterns in both parties (slightly more for Democrats). Going from a margin of victory of just a few votes to winning all of the votes predicts a shift of 17.3 points to the extremist end of the scale for Democrats, and a shift of 8.8 points to the extremist end of the scale for Republicans.
Regression for non-stats geeks
Regression is a statistical technique that estimates the correlation between an “input” and an “outcome” variable. Multiple regression, which we use here, measures the correlation between multiple input variables and a single output variable, estimating the correlation for each variable while holding all other variables constant.
By “outcome” variable, we mean the factor we are trying to estimate. By “input” variable, we mean the factors that we think cause the outcome variable.
In this particular case, we refer to extremism as the “outcome” variable because we set up the linear regression to predict an extremism score outcome based on a set of “inputs.” The “inputs” are the member’s party, the member’s dependence on small donors, the member’s dependence on one percent of the one percent donors, and the margin of victory.
The computer gives us estimates for each of the inputs. This gives us our first, or “estimate” column. The estimate is really the effect of each factor on our “outcome” variable. The bigger the estimate, the higher the correlation between the “input” variable and the “outcome” variable, extremism.
It’s an estimate because it is a best guess given the data we have. It is essentially an average effect. If we had a hypothetical member of Congress and knew her party, her share of money from different sources and her margin of victory, we could use the estimates given to get a predicted DW-Nominate value within some margin of error.
But our estimates are not perfect. Each estimate comes with a “standard error” term, which tells us how much confidence we should have in the precision of each estimate. The lower the “standard error” the more confidence we should have in the estimate. The “t value” is the ratio of the estimate to the standard error.
General statistical convention is that if the t-value is greater than 1.96, the estimate is considered “statistically significant.” When statisticians say something is “statistically significant” that means they are 95% certain that the relationship is real, and not happening simply due to random chance. The higher the t-value, the more certain it is that this is a real correlation. The lower the t-value, the less certain. Looking at the t-value is good shorthand for seeing how reliable the correlation is.
Finally, the “adjusted r-squared” at the bottom of the table is a measure of how much of the variation this regression explains. A score of .50 means that about half of the variation in extremism can be attributed to the factors I’ve included, and half is due to other factors not included. By political science standards, half is pretty good, especially with only four variables.
Back to the analysis
One possible concern is that this leaves out another type of “big money” – PAC contributions. I ran a separate regression that controls for PAC contributions. PAC contribution share by itself is not significantly correlated with ideology for either party, which allows us to reject the hypothesis that more moderate members depend more on PAC contributions. But interestingly, when we control for PAC contributions, we get stronger statistical relationships among Republicans between both conservatism and 1% of the 1% share and between conservatism and small donors share. Interestingly, the coefficients don’t change among Democrats.
Table 2.
Regression results, model 3
| Estimate | Std. Error | t value | |
|---|---|---|---|
| (Intercept) | 30.2 | 10 | 3.02 |
| Is Republican | 12.3 | 13.2 | 0.929 |
| Is Democrat x share from small donors | 41.9 | 23.4 | 1.79 |
| Is Republican x share from small donors | 60.8 | 21 | 2.9 |
| Is Democrat x share from 1% of the 1% | -2.88 | 26.3 | -0.109 |
| Is Republican x share from 1% of the 1% | 78.5 | 25.1 | 3.12 |
| Is Democrat x share from PACs | 1.16 | 12.2 | 0.0951 |
| Is Republican x share from PACs | 15.5 | 10.4 | 1.48 |
| Is Democrat x margin | 17.1 | 5.18 | 3.31 |
| Is Republican x margin | 9.69 | 4.5 | 2.15 |
Adjusted R-squared = .50
I also ran a separate version of the first regression without controlling for party. The reason to do this would be if we believed that the baseline difference in extremism for the two parties should not be taken as an external factor in our analysis, but instead we think it is actually a function of the sources of money. If we believed that, we would get slightly different results, described below. The results below estimate correlations between conservatism and 1% of the 1% dependence among Republicans twice as large as the above regressions. They also indicate that, all else equal, Democrats who depend more on the 1% of the 1% are more conservative than Democrats who depend less on the 1% of the 1%.
Table 3.
Regression results, model 3
| Estimate | Std. Error | t value | |
|---|---|---|---|
| (Intercept) | 41.2 | 2.68 | 15.4 |
| Is Democrat x small donor share | 23 | 17.5 | 1.31 |
| Is Republican x small donor share | 65.6 | 16.8 | 3.89 |
| Is Democrat x share from the 0.01% | -36.6 | 15.5 | -2.37 |
| Is Republican x share from the 0.01% | 115 | 16.9 | 6.79 |
| Is Democrat x margin of victory | 8.37 | 4.64 | 1.8 |
| Is Republican x margin of victory | 16.6 | 4.2 | 3.95 |
Adjusted R-squared = .47
I played around with a bunch of other specifications, and am pretty confident that the relations between conservatism and 1% of the 1% share among Republicans is real and robust. The relationship between conservatism and 1% of the 1% share among Democrats is less robust. It may exist, but it will take more analysis to know for sure.
Conclusion
The data here suggest that 1% of the 1% donors exert a conservative tug on American politics. Though we would be wise not to infer too much from correlations, especially without the benefit of over-time analysis, the results here are striking.
The parties are symmetrical in that more extreme members rely more on small donors than their moderate colleagues. But they are asymmetrical in that among Republicans, the most conservative members get more of their money from 1% of the 1% donors than their moderate colleagues, while among Democrats, the most moderate members on average get slightly more of their money from 1% of the 1% donors than their more liberal colleagues, all else being equal
In other words, 1% of the 1% money appears to reward conservative Republicans as compared to moderate Republicans. And it may slightly reward moderate Democrats as compared to liberal Democrats.
This is consistent with the surveys conducted by political scientists Benjamin Page, Larry Bartels and Jason Seawright, who find that very wealthy Americans tend to prefer significantly less government spending and economic intervention than the population at large. Limited government and low taxes are hallmarks of conservatism in American politics.
Given the ever-increasing costs of elections, candidates who can raise large sums of money from wealthy donors stand an advantage over those who can’t. Since big Republican donors appear to prefer conservative over moderate Republicans, it encourages Republicans to move in a more conservative direction. The prediction, then, is that as 1% of the 1% donors become more important as the costs of elections climb ever higher, Republicans will become even more conservative, especially on economic issues. As for Democrats, the prediction is that they will be rewarded for becoming slightly more moderate. Time will tell.