Services, Resources and Tools for Mapping Data
 Long ago, putting together a map of data points would be the sole domain of a skilled GIS practitioner employing an application like ArcView. These days, particularly with the advent of Google Maps, Yahoo Maps and OpenStreetMap, et al., there are a multitude of options for an individual to employ in displaying data geographically. Of course, there are, and will always be, technical options that require some level of programming chops. Fortunately, the pool of drop dead easy implementations that anyone can throw together with ease has grown a lot over the last few years. Then, there is the growing middle ground, lying somewhere between easy but rigid and difficult but flexible. Personally, I tend to hover in this netherworld, leveraging existing code, services or tutorials when possible but occasionally finding myself diving into the more technical areas when necessary and learning a lot in the process.
For those of you out there who might be interested in mapping data, I’ve put together a collection of links to a variety of services, code samples, resources and tutorials I’ve found useful in the past. These links range from new services that barely require anything more than a spreadsheet to complicated frameworks that require a great deal of technical knowledge. This is by no means all encompassing and if you happen to have additional links you’d like to share, feel free to leave them in the comments.
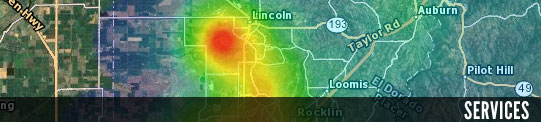
- Spatial Key “SpatialKey gives decision makers quick, easy, and cost-effective access to location intelligence so they can better achieve their objectives.”
- Many Eyes Many Eyes displays data associated with geographic regions using either colors or bubbles.
- Maker “Anyone can build complex, data-rich maps.”
- Tableau “With Tableau Public you can create interactive graphs, dashboards, maps and tables from virtually any data and embed them on your website or blog in minutes.”
- Mapspread “Import your data, geocode it, share it with coworkers and friends, create thematic maps, create interactive applications.”
- Zeemaps Custom maps from lists.
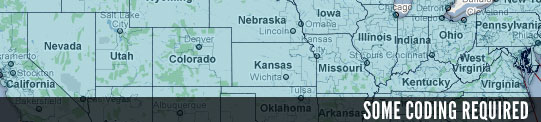
- Cartographer.js (javascript) A great javascript library that lets you create thematic maps by leveraging Google Maps.
- Protovis (javascript) “A graphical toolkit for visualization” that can be used in conjunction with Google Maps.
- MapBox “MapBox is a suite of open source tools to create beautiful custom maps in Amazon’s cloud. ”
- ModestMaps (python, actionscript) “Modest Maps is a BSD-licensed display and interaction library for tile-based maps in Flash and Python.”
- ClearMaps (new, from SunlightLabs) “An action script mapping framework”
- Mapfluence “Mapfluence is a suite of easy to use web mapping, visualization, and analytic APIs…”
- Mapnik “Mapnik is a Free Toolkit for developing mapping applications.”
- TileCache “TileCache provides a Python-based WMS-C/TMS server, with pluggable caching mechanisms and rendering backends.”
- gheat “A map tile server for a heatmap layer” on top of Google Maps.
- OpenLayers “OpenLayers makes it easy to put a dynamic map in any web page. It can display map tiles and markers loaded from any source.”
- Raphael (javascript) “Raphaël is a small JavaScript library that should simplify your work with vector graphics on the web.”
- ColorBrewer “Color advice for Cartography”
- Geocoder “Convert multiple addresses to GPS coordinates”
- Google’s Geocoding service
- BatchGeoCode Batch geocode addresses in a spreadsheet with ease.
- Mapstraction “Mapstraction is a library that provides a common API for various javascript mapping APIs to enable switching from one to another as smoothly as possible.”
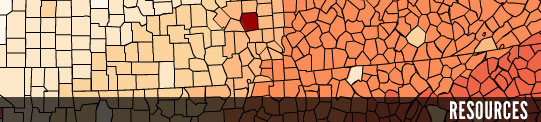
- Flowing Data: Thematic Maps (choropleth with Python, SVG)
- Maps in R
- GoodMorning (processing based)
- Thematic Maps with Cartographer.js
- Using MapBox tiles with Google Maps
- Recreating Oakland Crimespotting with Protovis (See: Oakland.Crimespotting)
- Google Maps API Tutorial
- Generate a Google Map from a spreadsheet
- Quickly visualize and map a data set using Google Fusion Tables
This TED 2010 talk is also worth watching to see the future of online mapping.