The Political One Percent of the One Percent: Megadonors fuel rising cost of elections in 2014

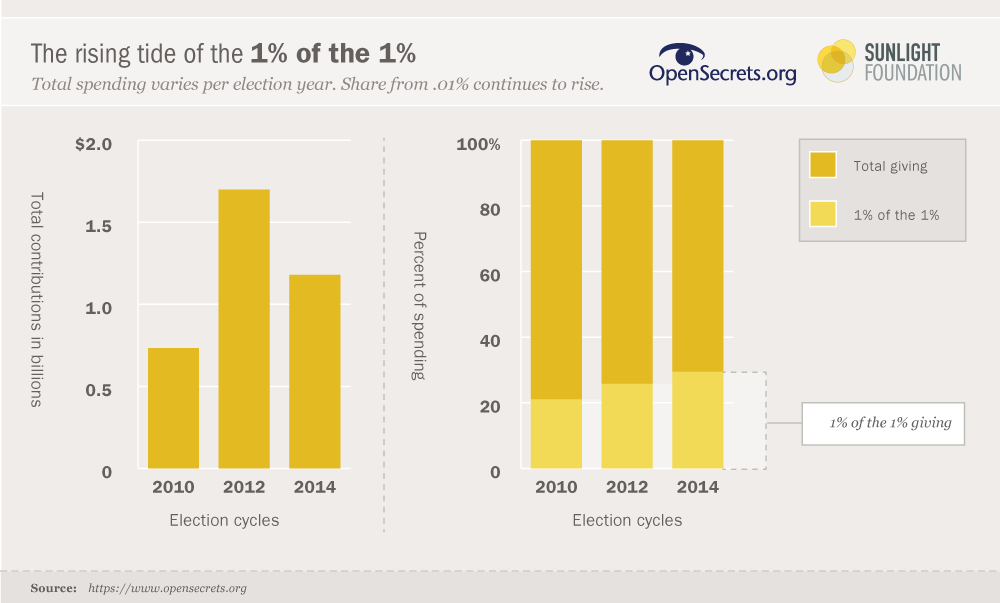
In the 2014 elections, 31,976 donors — equal to roughly one percent of one percent of the total population of the United States — accounted for an astounding $1.18 billion in disclosed political contributions at the federal level. Those big givers — what we have termed the “Political One Percent of the One Percent” — have a massively outsized impact on federal campaigns.
They’re mostly male, tend to be city-dwellers and often work in finance. Slightly more of them skew Republican than Democratic. A small subset — barely five dozen — earned the (even more) rarefied distinction of giving more than $1 million each. And a minute cluster of three individuals contributed more than $10 million apiece.
The last election cycle set records as the most expensive midterms in U.S. history, and the country’s most prolific donors accounted for a larger portion of the total amount raised than in either of the past two elections.
The $1.18 billion they contributed represents 29 percent of all fundraising that political committees disclosed to the Federal Election Commission in 2014. That’s a greater share of the total than in 2012 (25 percent) or in 2010 (21 percent).
It’s just one of the main takeaways in the latest edition of the Political One Percent of the One Percent, a joint analysis of elite donors in America by the Center for Responsive Politics and the Sunlight Foundation.
When former Sunlight fellow Lee Drutman first reported on the One Percent of the One Percent, he noted that these deep-pocketed donors were increasingly playing the role of “political gatekeepers.” Candidates needed their backing — and cash — as did the parties and super PACs that depended on the support of the politically active elite.
Now, in the first full midterm since the Supreme Court’s Citizens United decision, our joint analysis finds that the influence of the One Percent of the One Percent has only continued to grow.
Thanks to research and analysis by the Center for Responsive Politics, we know that those 31,976 top donors combined accounted for more than one out of every four dollars raised by PACs, super PACs, parties and candidates in the 2014 election cycle. Members of the group contributed at least $8,800, a bit less than in prior cycles. The median contribution was $14,750, while the biggest donor gave more than $73 million. (For more on how we arrived at those figures, see our methodology section.)
Wall Street maintained its perch as the most influential sector among the One Percent of the One Percent, both in the number of donors that made the list and the money given. Individuals that listed a job in securities spent about $175 million in 2014, of which $107.5 million went to committees supporting Republicans.
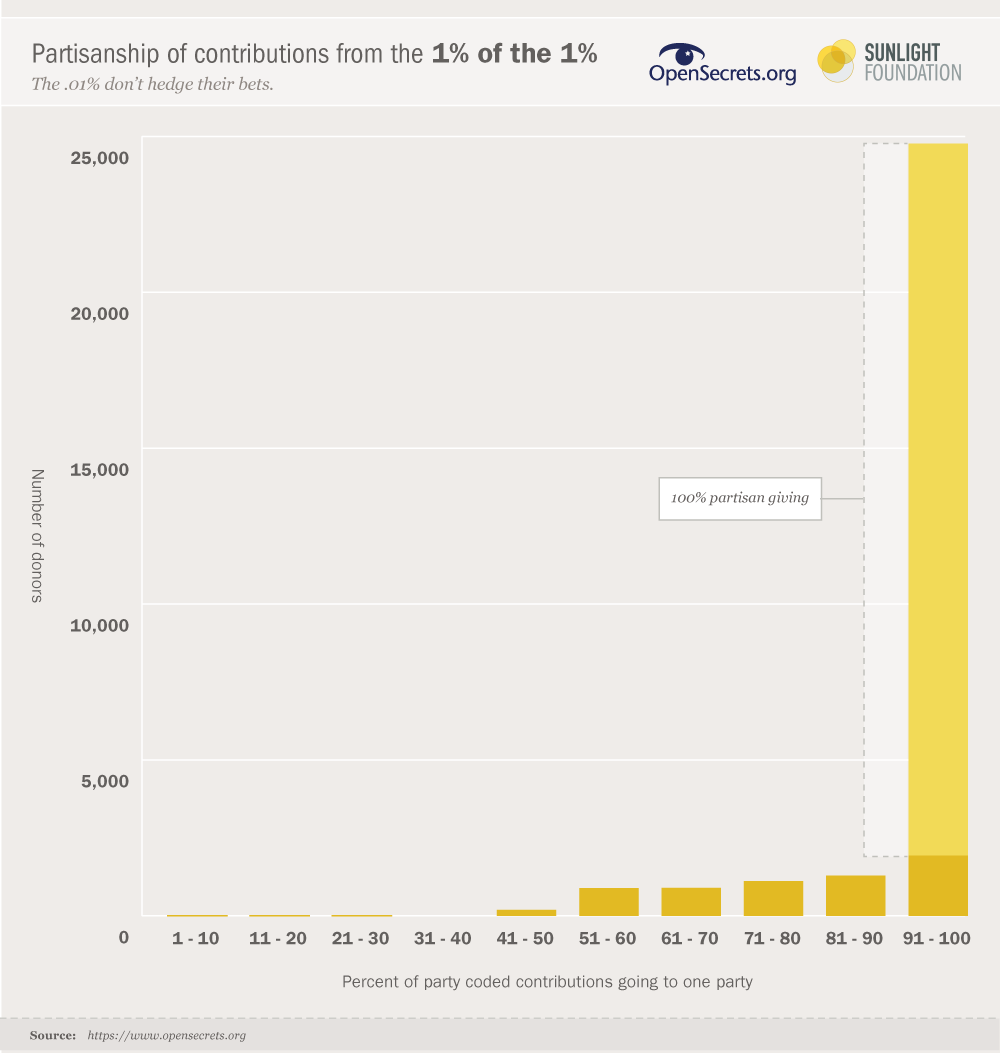
Though both parties depend on these donors, the GOP received more from them than Democrats, based on the contributions we could conclusively attribute to helping one party or the other. Mirroring the overall trend of the election, in which conservatives edged their liberal opponents in fundraising, Republican committees and conservative groups that support them pulled in about $553 million from the donors on our list, more than the $505 million that Democratic and liberal political groups received. The donors themselves, however, aren’t interested in hedging their bets — most of the contributors’ giving patterns heavily favored one party.
The most jarring difference between the One Percent of the One Percent in 2014 and 2010, the last midterm cycle, is how “top heavy” the donor list has become. A small subgroup of these elite donors is the driving force behind its growing share of political money.
In 2010, only 14 individuals contributed a total of $500,000 or more, while members of the $1 million-plus club numbered only eight. In 2014, the number of $500,000 and up donors ballooned to a whopping 134, and 63 people gave more than $1 million.
Each of the top three financial benefactors in 2014 contributed more than $10 million. Topping the list is Tom Steyer, the liberal-leaning San Francisco hedge fund manager and environmentalist who accounted for $73 million alone — the vast majority of which went to super PACs targeting GOP candidates. See the top 50 donors below.
The rising numbers of donors who gave at least $500,000 reflects, in part, the sharp uptick in liberal giving to outside spending groups, which can take money in unlimited amounts. In a change from both 2012 and 2010, more than half of the One percent of the One Percenters’ contributions to outside groups went to those that supported Democrats and attacked Republicans. Liberals have learned to love the super PAC.
The donors at the very top of the money pyramid provided the financial fuel for many of the attack ads and other messages from independent organizations that filled the airwaves last year. A previous analysis by the Center for Responsive Politics found that the country’s top 100 donors accounted for 39 percent of the $696,011,919 raised by super PACs in the 2014 elections.
Read on for more about the top political financiers who are increasingly steering U.S. elections. You can download the raw data on the One Percent of the One Percent’s contributions in 2014 here. See our methodology section below for important notes on data and the tables included.
Who are the One Percent of the One Percent?
The gender and economic sector breakdown of the country’s top donors has remained remarkably fixed over the past three election cycles.
Gender
| Cycle | Gender | Donor Count | Total | Party_Coded | Dems/Liberals | Repubs/Conservatives |
|---|---|---|---|---|---|---|
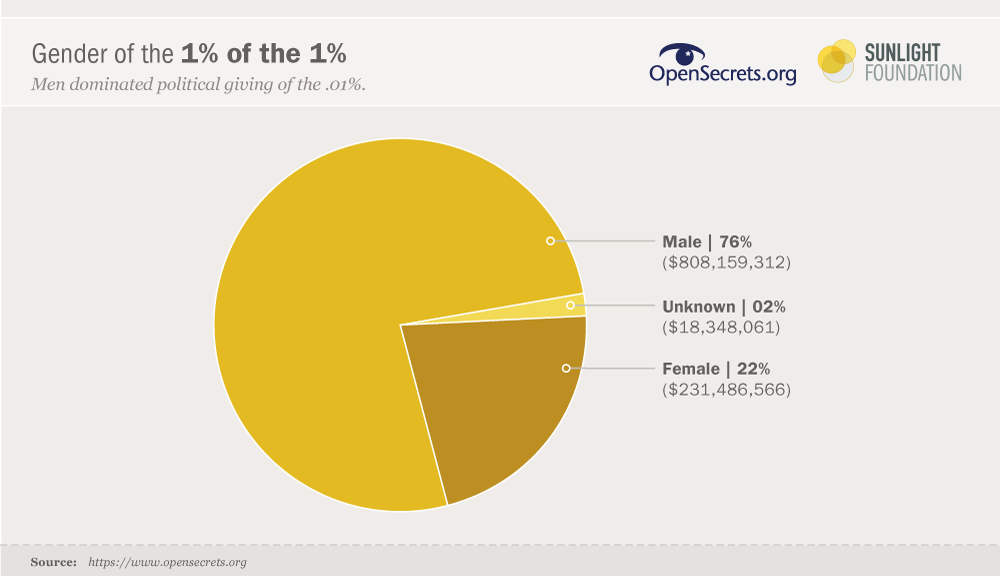
| 2014 | Male Donors | 22,978 | $905,399,299 | $808,159,312 | $362,845,024 | $444,418,056 |
| 2014 | Female Donors | 7,813 | $252,667,524 | $231,486,566 | $126,955,136 | $104,278,930 |
| 2014 | Undetermined | 1,185 | $21,723,398 | $18,348,061 | $14,788,990 | $3,487,359 |
Compared to the population at large, men are heavily overrepresented among top political donors. We were able to reliably ascertain a gender for about 95 percent of the donors in 2014. Of those, just under 75 percent were men, who accounted for 78 percent of the total contributions — almost exactly the same ratios as in 2012 and 2010.
There are even fewer female donors at the high end of the scale. Just one cracked the top 20: Linda McMahon, World Wrestling Entertainment executive and a $3 million donor to Republican candidates and right-leaning outside groups.
Among donations that could be classed ideologically or by party, women on our list gave 55 percent to liberal causes compared to men who gave 55 percent to conservatives.
Sector
Among the economic sectors defined by the Center for Responsive Politics, the finance, insurance and real estate category (FIRE) remains the best represented among the One Percent of the One Percent. It accounted for a larger portion of donors, and money, than any other sector — about 8,177 donors who gave 31 percent of the elite group’s contributions. (For a full list of sector codes and descriptions visit Opensecrets.org.)
As with all donors in the cycle, contributors that listed an occupation in the FIRE sector were the largest benefactors of both parties, and their giving leaned conservative. “Miscellaneous business,” a sector that includes a range of interests from retail shops and restaurants to steel production and textiles to alcoholic beverages and funeral services, and the energy and natural resources sector round out Republicans’ top three. Ideological givers — contributors whose donations are almost exclusively based on single policy issues — and lawyers round the Democrats’ top givers.
The loneliest sector in our analysis? That distinction goes to organized labor, which accounted for 75 donors and $349,795 in contributions in our data.
Industries and employers
For a more detailed view of the .01 percent — and the returns they may be looking for from their political investments — we also broke down the top donors by their employer and their employer’s industry. You can see a list of the industry codes as well as a description of each on Opensecrets.org.
Top industries
| Cycle | Industry | Donor Count | Total | Party_Coded | Dems and Liberals | Repubs and Conservatives |
|---|---|---|---|---|---|---|
| 2014 | Securities & Investments | 3,128 | $176,255,051 | $170,130,776 | $61,644,006 | $108,359,670 |
| 2014 | Retired | 5,500 | $86,041,679 | $85,758,464 | $39,817,941 | $45,797,823 |
| 2014 | Misc Finance | 1,260 | $81,259,596 | $63,091,010 | $32,118,895 | $30,911,865 |
| 2014 | Environment | 490 | $79,125,549 | $77,996,611 | $77,752,098 | $241,413 |
| 2014 | Real Estate | 2,353 | $67,094,949 | $63,481,818 | $27,037,892 | $36,366,776 |
| 2014 | Lawyers/Law Firms | 2,917 | $58,922,580 | $54,454,565 | $42,312,311 | $12,013,578 |
| 2014 | Oil & Gas | 1,225 | $43,854,127 | $38,741,326 | $3,154,012 | $35,582,714 |
| 2014 | Lobbyists | 996 | $29,282,857 | $28,869,918 | $13,738,211 | $15,124,707 |
| 2014 | Business Services | 1,233 | $27,257,693 | $26,456,547 | $12,017,249 | $14,422,948 |
| 2014 | NonProfit Institutions | 470 | $25,418,608 | $24,987,708 | $20,152,341 | $4,810,017 |
Given the large representation of the FIRE sector, it’s not a surprise that one of its industries, securities and investments (Wall Street for short), was the career choice of the largest number of the One Percent of the One Percent, who generally favored the GOP.
By contrast, environmental interests were the biggest bankroller of Democratic candidates and the party committees and outside groups that supported them in 2014. That’s thanks largely to the $73 million contributed by Steyer, the former hedge fund manager turned global warming activist, which vaulted this grouping to the top spot for the Democrats.
But that doesn’t mean that Wall Street has shortchanged Democrats: The securities and investment industry had the second-largest representation among individuals in the One Percent of the One Percent who gave to Democrats and liberal outside groups. In fact, the top five industries by party are similar — both also include real estate and miscellaneous finance in the top five. Donors from the oil and gas and manufacturing industries round out that list for Republicans.
While environmental giving surged among the .01 percent, the largest drop between our 2010 and 2014 lists goes to pro-Israel interests and donors in the insurance industry. In the case of the latter, their contributions surged during consideration of the Patient Protection and Affordable Care Act, or Obamacare, in the last midterm cycle.
Top employers
Goldman Sachs, the global investment bank, was the most prolific organization on our 2014 list, with more employees among the One Percent of the One Percent’s list of super donors than any other organization we could identify. The bank is a seasoned player in the Washington influence game. Goldman has kept the top spot on our list for the past three election cycles, and was also the number one contributor on the Fixed Fortunes 200, Sunlight’s ranking of the top 200 most politically active companies in the country. Several other financial titans join it in the top 10, including Citigroup and the Blackstone Group investment firm.
Google has upped its influence considerably in the past four years, moving up from 70th place on the 2010 list of organizations with the most employees in the Political One Percent of the One Percent, to seventh in 2014. Microsoft was the only other tech company to crack the top 20. Despite recent reports on the tech industry’s growing political clout, Silicon Valley is still playing catchup to Wall Street when it comes to playing the Washington influence game.
Note: Our list of the top employers only includes donors for whom we could reliably identify an employer, generally based on disclosures made by political committees to the Federal Election Commission.
New donors
The makeup of this elite set of individuals is constantly in flux. Each election cycle brings out a different group of donors as the political landscape shifts, the candidates change and vehicles for fundraising evolve. Some givers are more prominent in presidential election cycles, while others seem to focus heavily on congressional races and appear most prominently in midterm election cycles. But since 2010’s Citizens United decision, extremely wealthy individuals can catapult themselves into the highest echelons of the donor world with ease — one enormous check to a super PAC or other outside group can do the trick.
That is exactly what happened in a number of cases in the 2014 cycle. An analysis of individuals who did not appear on the 2012 list but popped up in 2014 suggests that there is a new breed of elite donor infiltrating the top tier of rainmakers.
For example, Jeremy Grantham, a Boston investor and philanthropist known for his support of environmental causes, made a handful of donations prior to the 2014 cycle — some of them quite large — but the contributions were spotty and inconsistent in size. In 2004 and 2008, the combined donations of Grantham and his wife would be large enough to make the list of the top one percent of one percent of donors, but not in 2002 or 2010. And there is no record of him having made any donations over $200 in 2012. He would be, at times, considered a large donor by the standards of most Americans, but in 2014, he wrote one check that made him a major part of the conversation — $1.65 million to the League of Conservation Voters super PAC. With that one gift, Grantham not only put himself in the top one percent of one percent of donors for 2014, he landed at No. 33.
Similarly, Ronald Firman, a retired Florida real estate investor, never donated more than $200 to a federal political campaign, according to Center for Responsive Politics data. That is, until 2012, when he donated just $3,750 — $3,000 of which went to a congressional candidate, Florida Republican Paige Kreegel, with the remaining $750 sent to Mitt Romney’s presidential campaign. Despite having no sign of being a political kingmaker or elite donor, Firman joined the .01 percent of political donors in 2014 by writing checks for more than $1.47 million to a super PAC solely devoted to Kreegel’s unsuccessful bid in the Republican primary to fill the seat vacated by Rep. Trey Radel, R-Fla. Firman finished 2014 just a few spots behind Grantham at No. 37 on the biggest donors list.
Many of the names on the list, of course, are stalwarts who have been among the nation’s top donors in nearly every recent election cycle. Ten of 2014’s top 20 names were in the top 20 in 2012, and none of the top 20 were new to the .01 percent. Sheldon Adelson and his wife may not have matched his record-setting sum of more than $93 million in contributions in 2012, but he alone still threw in $5.8 million in 2014. Liberal super donor Tom Steyer gets the award for most dramatic ascent into the top tier of the super donors: He gave only $115,000 in 2012 (ranking him No. 1,458), before claiming the top spot in 2014 with his $73 million in donations. On the other hand, Oracle founder Larry Ellison went in the opposite direction: He was No. 19 in 2012, with donations of $3.1 million, but only gave $94,360 in 2014.
The deaths of Harold Simmons and Bob Perry — two of the biggest donors to political causes of all time — in the 2014 cycle caused some turbulence on the list. In 2012, Perry, a Texas construction magnate, gave $23.5 million, mainly to conservative super PACs, putting him at No. 4 on the list (he was No. 1 in 2010). He died in early April 2013, but that didn’t stop him from qualifying for the top .01 percent of donors — he gave $3.1 million just in the first few months of the year. Simmons, another Texas billionaire known for giving to conservative causes, died in December 2013 having given a mere $362,000 for the cycle — just a fraction of the $25.7 million he handed out in 2012, which put him No. 3 on the list that year. His latest, and final, tally was more than enough to keep him in the .01 percent club, though.
Geography
The One Percent of the One Percent are clustered around major metropolitan areas.
Political observers deem certain zip codes “political ATMs” for the large number of wealthy donors willing to bankroll campaigns, parties and political causes. The high density of big potential backers makes certain areas very appealing to politicians raising money.
Top states
A review of the top zip codes on our One Percent of One Percenters list finds much of the money comes from donors who live near population hubs like New York, San Francisco, Chicago and Washington. Of the 50 zip codes that produced the most money from the .01 percent, 14 were in New York, eight in California and five each were in Texas and Illinois.
Zip codes
Some of the most fertile fundraising grounds are clustered around the Big Apple. Sixteen of the most most generous zip codes were within a one-hour drive of New York City.
Where the money goes
Though dark money spending — which is not included in this analysis because dark money groups don’t disclose their donors — increased in the 2014 election cycle, the super rich fueled a modest rise in super PAC spending as well. Party committees and members of Congress continued to be favored recipients of the deepest-pocketed donors.
Recipients
| Cycle | Recipient Category | Total | Party Coded | Dems/Liberals | Repubs/Conservatives |
|---|---|---|---|---|---|
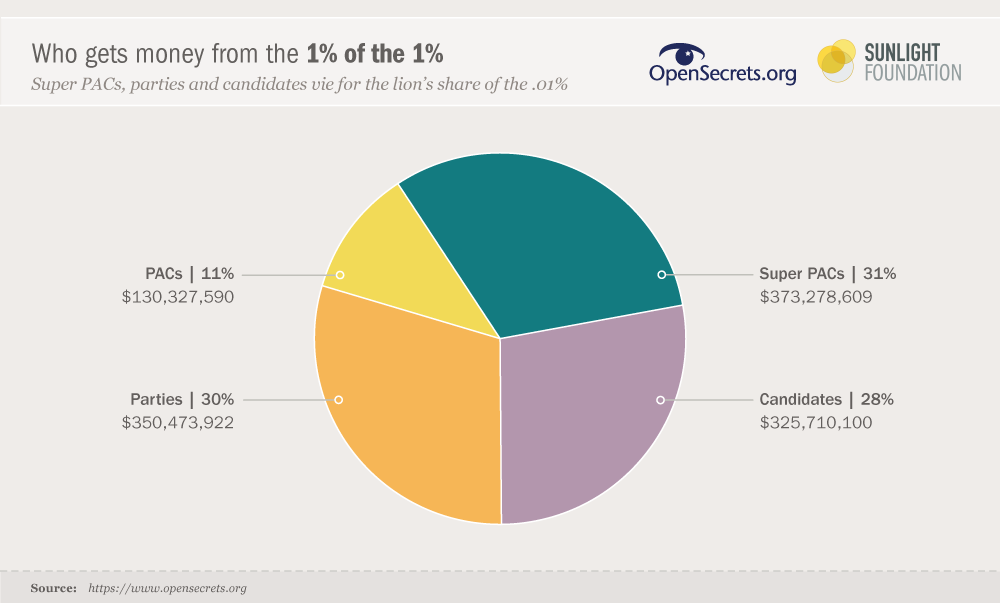
| 2014 | Outside Money | $373,278,609 | $348,103,555 | $194,218,940 | $153,884,615 |
| 2014 | Parties | $350,473,922 | $350,473,922 | $154,982,989 | $195,018,033 |
| 2014 | Candidates | $325,710,100 | $325,710,100 | $143,379,458 | $181,629,698 |
| 2014 | PACs | $130,327,590 | $33,706,362 | $12,007,763 | $21,651,999 |
Outside spending
The 2010 midterm cycle saw more than $38.6 million of the nearly $732.8 million spent by the One Percent of the One Percent go to outside groups, or about 5 percent of their total contributions. In 2012, contributions to super PACs and hybrid super PACs accounted for about 30 percent of the $1.7 billion contributed — and in 2014, that share inched up again 31.5 percent of this group’s spending, for about $373 million.
The liberal bent to the top donors’ super PAC giving is a sharp departure from the past two cycles. Conservatives accounted for 70 percent of the contributions in 2012 and 80 percent in 2010.
Donors in the One Percent of the One Percent accounted for almost all of the individual contributions to super PACs in the midterms and about 54 percent of all contributions (including those from corporations and labor unions) raised by super PACs. The biggest donors are one of the driving forces behind the continuous rise in outside campaign money.
Parties and candidates
Both parties are reliant on donations from the One Percent of the One Percenters. Democratic party committees raised roughly 18 percent of all their contributions from this group, compared to 29 percent by Republicans. That did not prevent Democratic Party committees from outraising their conservative opponents in 2014.
Congress and the One Percent of the One Percent
As in previous analyses, every current member of Congress received money from the One Percent of the One Percent in 2014. You can see the candidates that rely the most — and least — on these super donors above.
Many of the candidates who received the least from the .01 percent represent poorer, urban districts. The two Republicans with the lowest share of money, Tom MacArthur of New Jersey’s 3rd District and Curt Clawson, who won the special election to replace Trey Radel in Florida’s 19th District, both ran largely self-financed campaigns.
Our list of the 10 candidates who received the highest percentage of the money from elite donors includes many candidates from wealthy states, and nationally-known candidates like Sens. Cory Booker, D-N.J., and Ted Cruz, R-Texas, as well as new members who won high-profile races in 2014, like Sens. Dan Sullivan, R-Alaska, and Tom Cotton, R-Ark.
See the following link for more detailed data on the One Percent of the One Percent’s contributions to members of Congress.
Methodology:
This analysis relies on donor IDs as well as industry and sector codes researched and assigned by the Center for Responsive Politics. In cases where two donors tied for overall contributions, both donors were included. The number of donors was expanded from previous years to reflect 2014’s larger population.
In the tables, the sum of contributions to Democrats/liberals and Republican/conservatives will be lower than the value in the total contributions field. This is because not all contributions could be reliably associated with supporting one party. The percentages of one party giving are out of all the contributions that could be party coded.
Some important notes: These figures represent all the political contributions to traditional political action committees, super PACs, party committees and political committees affiliated with federal candidates. In keeping with previous reports in this series, we did not include contributions to 527 political organizations that are not registered with the Federal Election Commission. These totals do not include contributions to politically active nonprofit organizations, also known as “dark money” groups, which do not publicly disclose their donors. Note that some totals for the 2010 and 2012 cycles in this analysis differ from what was originally reported; for this study, we used the most recently updated data available.