OpenGov Voices: Nashville’s police data reveals racial burden

Operation Safer Streets has become the epicenter of Nashville’s debate over policing and racial justice. Every weekend, the Metropolitan Nashville Police Department funnels police officers to hotspots for gang and criminal activity, arguing that a visible police-presence deters crime. Since 2011, Safer Streets has resulted in more than 5,000 arrests and 50,000 vehicle stops, according to WKLN (Nashville Public Radio).
Racial justice activists have criticized the program as disproportionately targeting black, immigrant and low-income neighborhoods. As Nashville’s Black Lives Matter has said, Safer Streets “mostly targets innocent people for doing the same things that people in Green Hills do without punishment.”
MNPD touts Safer Streets in regular press releases, reporting the number of vehicle stops, arrests and drug seizures they – in their words – “netted” each week. After extracting the text from these articles with some code, I identified which streets, blocks and intersections have been targeted. (See methodology below.*)
After looking at the numbers, what BLM and others have been saying is right: Nashville Safer Streets is not color-blind. Its burden falls disproportionately on communities of color.
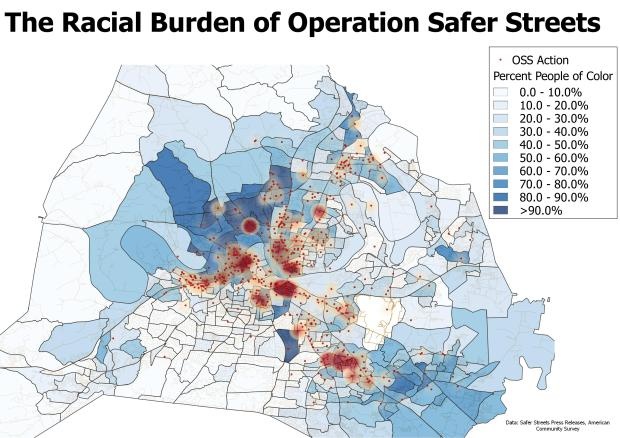
In total, 70 percent of Census Block Groups in Nashville are majority-white, according to the five-year estimate of the American Community Survey. Yet, 60 percent of areas targeted by Nashville Safer Streets were mostly non-white, and 25 percent of targeted areas were more than 90 percent non-white.
Plotting Safer Streets actions alongside the racial composition of Nashville’s neighborhoods is striking. They are concentrated in three mostly black areas (North Nashville, the remaining black neighborhoods of East Nashville and the Chestnut-Hill Area of South Nashville) and one mostly immigrant community (Antioch along Nolensville Pike).
This matters. As Michelle Alexander notes, America’s syndrome of mass incarceration begins with overpolicing and ends with the economic and familial disruption of communities of color. Blacks and Hispanics are more likely to be stopped by the police, more likely to be arrested for drug-crimes despite lower drug use and more likely to get jail time. They are more likely to be stopped in part because of policies like Safer Streets.
My experiences as a Vanderbilt student highlight this disparity. On the weekends, I saw plenty of drug use. But the police didn’t regularly stop our vehicles and search us on the weekends like they do in low-income, predominantly non-white neighborhoods.
And I’m glad they didn’t. Plenty of us would have a different future if drug use was treated the same way on Greek Row as Lafayette Street, which has been targeted 77 times in the last few years by Safer Streets.
The traditional response from the police is that they target these predominantly black and low-income areas because they are known to be hubs of “gang-activity.” But this is self-fulfilling. If police systematically stop cars in poor neighborhoods, that is where they will find cars with drugs.
At the end of the day, the question is, does Operation Safer Streets actually make us safer? Safer Streets neglects the root causes of gang violence. It extracts tax revenue from the poorest neighborhoods in the form of citations and court fees. And it subjects tens of thousands of Nashvillians to arbitrary stops, undermining trust in law enforcement and, as recent events have shown, opening the door to a potentially violent encounter with law enforcement.
After all, what starts with a traffic stop ends too-often with a dead black man.
Methodology
*I converted each street to a latitude-longitude coordinate that represents its central location, using the Google Maps API. (I deleted from this data some streets like Old Hickory Boulevard and Dickerson Pike that were too vague to make any real inferences about where police activity occurred.) Next I matched each of these areas with its Census Block Group (the smallest Census area with data, comprising, on average, about 2000 people) to see whether non-white communities were disproportionately affected.
1) I searched for all news reports on the MNPD media releases page involving Operation Safer Streets. Then I extracted data from the OSS press releases about the areas involved (as well as arrests, stops, and seizures) using a Python script incorporating the Beautiful Soup Library and regular expressions (Attachment: “Extracted_Info“).
2) I converted each street to a latitude-longitude coordinate that represents its central location, using Python’s Geopy library and the Open Streets API. Some larger were too vague to make any real inferences about where police activity occurred, so I deleted them. My “cut-off” point for excluding a street was if the radius of the minimum bounding circle (smallest circle that includes the entire street) exceeded 5 kilometers. (Attachment: “Geolocate_Final”)
3) I spatially-joined search locations with racial data at the Block Group Level from the American Community Survey using the GIS software QGIS. Then I calculated the proportion of searches in majority-nonwhite and >90% nonwhite areas. (Attachment: “Data with Calculations“).
Interested in writing a guest blog for Sunlight? Email us at guestblog@sunlightfoundation.com