Measuring the impact of open data policies
After a year of diving into statistics in our graduate-level public policy program at the University of Chicago, we joined Sunlight’s local policy team as 2016 summer fellows. We were excited to apply our analytical skills to real-world practice and help Sunlight with their first quantitative explorations of open data policy and implementation.
Our preliminary quantitative analysis suggests that cities with open data policies that follow more of Sunlight’s guidelines also tend to do a more successful job at implementation.
There appears to be little existing quantitative research about open data policy and implementation in U.S. cities, partially because there aren’t many valid quantitative measures to evaluate open data on the city level, so we figured this would be an interesting topic to explore.
By extracting data from the US City Open Data Census [1] and Sunlight’s Open Data Policy Comparison: Best Practices [2] spreadsheet, we built a dataset to analyze the policy and implementation of open data across American cities. (While the Open Data Census is far from the perfect measure, it’s still the best and most comprehensive dataset we have available on open data implementation.)
The good and the bad
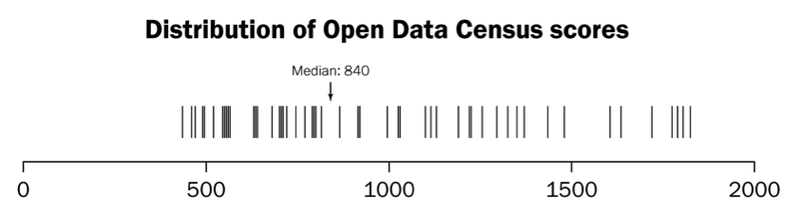
In the census, each city is given a score representing its overall open data performance. This score is the sum of the performance scores for 19 specific datasets. Among the 56 cities we recorded, the average overall score is 984, slightly more than half of the maximum possible score of 1900; the median is 840. There is a wide range in scores among the cities:
For each of the 19 datasets, we looked specifically at how cities are performing on: opening the datasets, putting them online, providing them in bulk and machine-readable form, creating an open license and updating them in a timely manner. With all the available submissions for the 56 cities, we calculated each city’s percentage of datasets that meet each of the criteria.
Many cities are doing well in certain areas. For the average city, 89 percent of the datasets exist, with 83 percent of them being posted online. Cities are also doing a good job in keeping them up-to-date, with an average of 74 percent of the datasets considered timely.
However, many cities have not realized the importance of providing the datasets in bulk and machine-readable form. The average city only provides 56 percent of the datasets in bulk form and 59 percent in machine-readable form. Additionally, datasets should have an open license, allowing them to be freely used, reused and redistributed; on average, cities only give 50 percent of their data sets an open license.
Exploring the data: Preliminary findings
With these numbers in hand, we were interested in exploring the factors that have an impact on the Open Data Census scores.
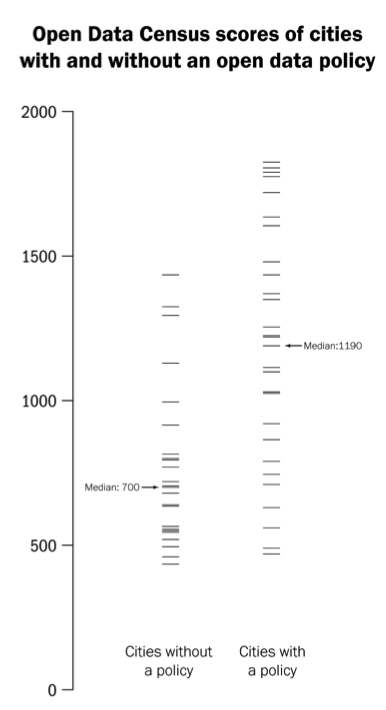
Not every city in the Open Data Census has a policy dedicated to open data, though they are all opening their data to some extent. Sunlight has made a map to record all the open data policies in place. Among the 56 cities extracted from the Open Data Census, 31 of them (55 percent) have an open data policy.
It is clear that having an open data policy likely helps improve the implementation of open data. Cities with an open data policy score significantly higher on the Open Data Census than cities without open data policies. See here for our preliminary statistical analysis and methodology.
We also found that cities tend to score higher on the Open Data Census when:
- The open data policy is stricter and more actionable
- The open data policy has been in place for longer
- The city assigns an open data manager or a chief data officer to oversee the open data policy implementation
Specifically, the average city’s score on the Open Data Census is positively correlated with the adoption rate of Sunlight’s Open Data Policy Guidelines, particularly the guidelines to create a list of data holdings, create an oversight authority, create binding regulations for implementation, and setting a clear implementation timeline. This is especially true when a city’s population is less than 1 million.
The What Works Cities initiative is at the core of Sunlight’s local policy work. Compared to other cities of a similar size, cities participating in the program tend to perform better on the Open Data Census and adopt more of Sunlight’s Open Data Policy Guidelines.
The cities participating in the What Works Cities program also tend to have a larger 5-year population growth rate, a higher median household income, and a lower poverty rate. This helps illustrate the fact that there are many variables involved here, so it’s very important to note that correlation between two factors does not imply causation, thus limiting the conclusions we can draw. Still, our preliminary analysis of this data yielded interesting findings, and the next step would be further analysis with more accurate data.
Footnotes
[1] Retrieved June 24, 2016. Only cities with sufficient submissions on datasets are included. (To top) [2] Retrieved June 24, 2016. (To top)