Death by Law Enforcement: What the data tells us – and what it doesn’t
When a police officer kills someone while trying to stop a crime or make an arrest, government agencies classify the death as a legal intervention. The death of Mike Brown, the 18-year-old and unarmed teenager killed by a police officer earlier this month in Ferguson, Missouri will likely be classified under this term when it comes time to report the circumstances of his death to the national databases that track such information.
For many people, especially Mike Brown’s family and friends, describing the loss of their loved one in such a dry, unemotional and even benign-sounding way, will be hard to swallow. But in an effort to get justice and respect for the life of Brown—and perhaps to stop more incidents like the one in Ferguson, which has caused weeks of protests and police standoffs — advocates and researchers will inevitably rely on data that agencies like the Centers for Disease Control collect.
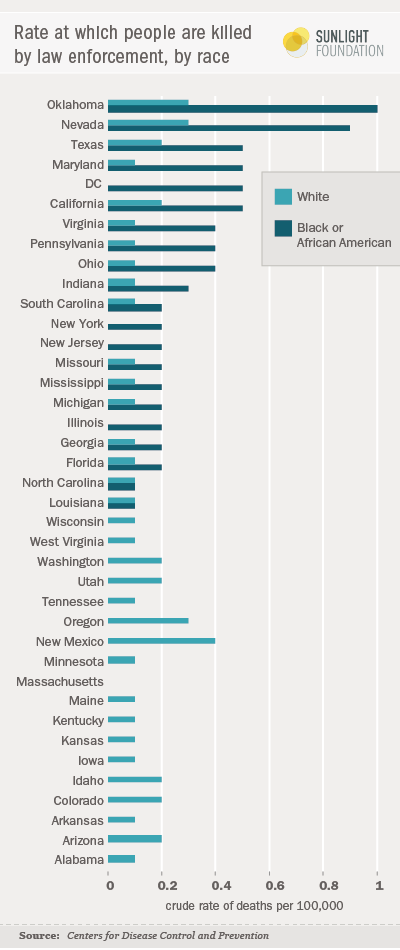
The CDC makes information about the rate at which people are killed by law enforcement available in its WONDER database, which stands for Wide-ranging Online Data for Epidemiologic Research. For instance, according to the CDC, in Oklahoma the rate at which black people are killed per capita by law enforcement is greater than anywhere else in the country. That statistic is taken from data collected for the years 1999-2011. During that same time period, Oklahoma’s rate for all people killed by law enforcement, including all races, is second only to New Mexico. However, Oklahoma, the District of Columbia, Nevada and Oregon are all tied for the rate at which people are killed. (The CDC treats the District of Columbia as a state when collecting and displaying statistics.)
In Missouri, where Mike Brown lived and died, black people are killed by law enforcement twice as frequently as white people. Nationwide, the rate at which black people are killed by law enforcement is 3 times higher than that of white people.
In a post that ran last week, Ruben Fischer-Baum at FiveThirtyEight argued that there might be data missing from what is made available regarding people killed by law enforcement agents nationwide. Whether that’s true or not, there is indeed data available that should be used and scrutinized.
The CDC has also created a dataset that attempts to create a clearer understanding of violent deaths and violence levels. That dataset, called the National Violent Death Reporting System (NVDRS), provides details about some of the deaths reported to the CDC that would otherwise go unrecorded, such as whether or not it was an argument or a fight that led to a death, or if a person was involved in a love triangle and killed because of it.
When a killing is the result of a legal intervention, NVDRS indicates whether the action was ultimately determined to be justifiable. Of the legal intervention cases reviewed by that survey, 95 percent were reported justifiable.
A huge caveat, though, in trying to use NVDRS is that the data is not nationally representative: Only 18 states participate.
At the very least, this information should prompt people to ask what is happening in these locations and how it can it be stopped. Ideally, knowing this information and examining the implications could lead to increased scrutiny of the deaths caused by legal intervention and serve to reduce the number of deaths in the future.
The datasets mentioned above have the potential to tell the public and policy makers more than has been detailed in this post. They also have limitations that could be improved upon, such as suppressed data availability due to privacy concerns, funding issues that hinder data collection and even website problems that make it hard to find and download relevant data. It might seem counterintuitive and less-than-sexy to address the deadliness of violence through the sterile lens people perceive data to be, but good evidence leads to good decisions and data can provide us with that.
Note: The data displayed in the graphic above is affected by protocol the CDC follows in an effort to protect personal privacy and to represent findings accurately. Small data values are suppressed for death counts between one and nine for all levels of granularity below national to protect the identity of individuals. For more information on suppression, visit the CDC’s website.
Further, some rates are marked as “unreliable” by the CDC when the death count is less than 20 and therefore leaves no data to show for the Black or African American category for Alabama, Arkansas, Colorado, Delaware, Kansas, Massachusetts, Tennessee, Washington and Wisconsin, as well as in data for White deaths in Montana, Nebraska, New Hampshire, New Jersey and South Dakota. Data that appear blank for White deaths in Illinois, Massachusetts and New York are actually recorded crude rates of 0 per 100,000.