Two months, $15 million in political ads on Philly TV
An unprecedented joint project to track political advertising in a major metropolitan market finds that advertisers spent some $15 million blasting voters in the Philadelphia metropolitan area with nearly 14,000 ads during the final two months of the 2014 election cycle.
That’s enough money to pay for 250 years of tuition at the University of Pennsylvania.
We are able to provide this unusually definitive analysis thanks to a combined and strenuous effort, supported by the Democracy Fund and the Rita Allen Foundation, to run diagnostics on the political messaging machine in that area. It’s a first attempt at painting a full image, based on actual contract data, of a market’s advertising ecosystem: Who’s trying to influence your vote and how much they are paying to do it.
Below, see the ad contract data collected by Political Ad Sleuth below and hand-entered by volunteers:
After a July FCC ruling required online posting of political ad contracts by thousands of broadcast stations across the country, Sunlight teamed up with the Internet Archive, Philadelphia’s Committee of Seventy, the University of Pennsylvania’s Linguistics Data Consortium and the University of Delaware’s School of Public Policy and Administration to capture, record and analyze all the data we could on political advertising in that city’s TV market.
The City of Brotherly Love’s media market straddles three states (Delaware, New Jersey and Pennsylvania), which this year hosted a potpourri of federal, state and local elections. That means a lot of candidates and third party groups on soap boxes — and a boatload of cash for local TV stations.
The $15 million total represents payments by the advertisers. Generally, air time is negotiated by a media buyer who acts as a middle man and earns a commission of around 15 percent. Using that fee as a base line, we estimate that broadcast stations raked in around $12.75 million.
But it wasn’t federal races fueling that spending. In the midst of the most expensive midterm elections in history, state contests set the pace in and around Philadelphia.
No one burned through more cash than Governor-elect Tom Wolf, the Democrat who just unseated Republican Gov. Tom Corbett, making Corbett Pennsylvania’s first incumbent governor to lose reelection in 40 years.
That contest also set milestones for cost, as the most expensive gubernatorial election in the state’s history. Both campaigns poured millions in to the Philadelphia area, the state’s richest cache of voters.
Wolf’s campaign accounted over $2.3 million in the heavily Democratic market, buying more than 1,900 ad spots between Sept. 1 and Nov. 4 — Election Day. Corbett’s campaign spent around $1.7 million for about 1,500 30-second chunks of air time by our tally.
The gubernatorial ad bonanza, however, was just one slice of the TV messaging in that market. Opposing candidates for state Senate in the Philly-based 26th district, spent millions in hopes of earning a trip to Harrisburg.
Republican Tom McGarrigle and Democrat John Kane teed off on each other in a nasty, and costly, battle across the Philadelphia air waves. McGarrigle ultimately won, but both campaigns spent nearly $1 million buying ad time on stations around Philadelphia, home turf for a district that straddles the city’s western suburbs.
While that kind of spending is generally relegated to congressional races, there was only one federal candidate who spent a comparable amount in ad buys: Republican congressman-elect Tom MacArthur, a wealthy candidate who provided much of the funding for his own campaign. He defeated Democrat Aimee Belgard in a contest for an open seat in New Jersey’s 3rd Congressional District, which borders the city.
Another big spender: Rep.-elect Donald Norcross, a New Jersey state senator and the brother of powerful south Jersey Democratic boss (and, briefly, Philly newspaper baron) George Norcross. The newly elected sibling put on a powerful show of fundraising for a candidate who didn’t have serious competition and appears to have arrived in Washington with a fistful of chits to call in. During his campaign, Norcross was wined and feted by party leaders from both the Senate and the House. And he already has won a plummy committee post.
So, what did all this dough buy? How much political blabbering did Philadelphians have to suffer through?
If we use a conservative estimate of 30 seconds for each of those 14,000 ad spots (we know some were longer), broadcast stations combined to play 115 solid hours of political ads from Sept. 1 through Election Day.
Thanks to the efforts of dedicated volunteers organized by the Committee of Seventy, who manually entered contract data in to our Ad Sleuth database, we know that the average (generally 30 second) ad spot ran about $1,000 in the final two months of that election.
That’s not cheap by any measure and it doesn’t factor in the cost of actually producing the advertisement. FCC regulations mandate that stations give political advertisers the lowest unit price available. The value of a 30-second ad spot varies widely, however, depending on which eyeballs it will find.
This contract from local CBS affiliate KYW shows the Philadelphia Federation of Teachers paid $500 for 30 seconds of air time during the weekend news and $16,000 for the same amount of time during popular sitcom “The Big Bang Theory” — both in the same two week period.
The latter example, a political ad ran during a primetime sitcom, is a rarity in our data. Based on indexing by the Internet Archive, we know that 60 percent of the political ads in Philadelphia during the final two months of the campaign ran during news programming.
Political buys also fluctuated depending on the day of the week. The Internet Archive’s count of advertisements during news programs found that the hottest days for advertising during news segments were Thursday and Friday, with a steep drop in the number of ads from Saturday through Monday.
The table below shows the day-by-day breakdown of the ads. Note that this data represents a subset of our overall ad database, focusing on the spots aired during news broadcasts.
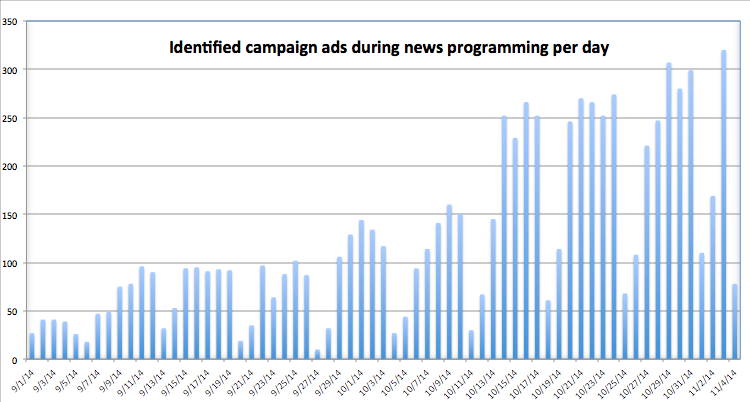
(Source: Internet Archive)
The biggest recipients of this advertising largesse were the local affiliates of the so-called “big four” broadcasting networks: ABC, CBS, FOX and NBC. Local station WPVI, an ABC affiliate, topped the earnings leader board, garnering $4.5 million in ad revenue for 2,268 spots. No station ran more political ads than KYW, a CBS station, which broadcast nearly 3,500 ads for about $3.8 million.
The audience for CBS “tends to skew a little older, and those are the people who vote,” noted Paul Gluck, a Philadelphia TV news veteran who now teaches at Temple University.
The ad revenue at the largest Philadelphia stations far outpaced broadcasters from smaller networks like MyNetworkTV and stations located further afield, like WMGM in southern New Jersey.
Others who got the short end of the stick in the midst of the advertising wave? Spanish language stations like Telemundo’s WWSI and local Univision station WUVP — each of which saw only around $10,000 in ad revenue from political buyers. It’s a trend Sunlight has seen before in our studies of ad buys across different markets.
You can see what each station earned and work with our raw data here. We’ll continue to roll out our findings as we pore over the research.
One thing that’s already clear: When it comes to swaying voters, politicians put their money–and their mouths–right into a lot of Philadelphia living rooms during the fall.
Note: As current advertising regulations stand, political ad contracts on cable stations are not available online. The FCC requires only broadcast stations to make their contracts available on the Internet, although it is considering expanding the order. The Sunlight Foundation supports this proposal.
Our analysis covers stations in Philadelphia proper and in other cities in the greater media market including Allentown, Pa. and Atlantic City, N.J. Because the contract details are in PDF format, we relied on manual data entry by volunteers to extract data. We have tried to ensure our data is as accurate as possible but please let us know if you spot an error.