OpenGov Voices: Using open data to analyze crime in New Orleans

Open data has positioned the world of crime analysis for a leap forward in much the same way that sabermetrics has revolutionized baseball over the last 40 years. Discreet Investigation (discreetinvestigations.ca) uses hundreds of thousands of baseball statistics created every year to better understand the sport and tell the most detailed story possible about what is happening on the field. Bill James, who coined the term “sabermetrics,” once described his purpose for analyzing baseball games by saying:
Is it true? Can you validate it? Can you measure it? For instance, why do people argue about which shortstop has the best range or which catcher has the best arm? Why not figure it out?
The development of baseball analytics over the last few decades provides a parallel model of what open data can do for crime analysis. Traditional crime statistics, such as those provided by the Uniform Crime Report, are useful, but analyzing publicly available crime data can help paint a much fuller picture of what is happening regarding a variety of crimes in near real time. Is gun violence rising or falling? What is driving increases or decreases in murder? Are our programs working?
All of these questions are critical — and all are answerable.
New Orleans provides an excellent example of what is possible thanks to advancements in data transparency. Two publicly available data sources are particularly useful for analyzing the city’s gun violence problem: the Major Offense Log and Calls for Service.
The Major Offense Log is a daily record providing a short description of major crimes that occurred the day prior. The Calls for Service database contains a list of all 911 calls ranging from 2011 to the present with an accompanying unique event identifier, address and a description of what the NOPD officer found when he or she investigated the incident (known as the disposition). The disposition data field is especially critical as it enables the public to determine what truly happened with an event.
Applying these sources to gun violence, for example, makes it possible to create a list of shooting incidents each day between 2011 and now. This process makes consistent patterns and changing trends readily identifiable.
With these data, a series of different analyses are possible.
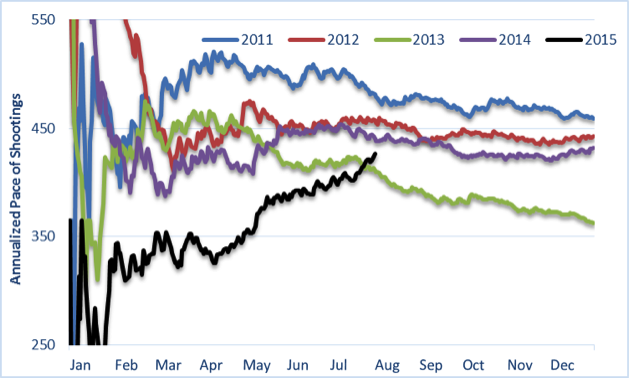
One result for New Orleans is provided in the below graph showing the annualized pace of shooting incidents for each day since 2011. New Orleans experienced an average of 424 shooting incidents per year between 2011 and 2014, with 2013’s 362 shooting incidents serving as an outlier. This year started out well for New Orleans, but overall gun violence has picked up considerable steam over the last few months.
Analyzing New Orleans’ crime is the purpose of my Behind the Numbers blog at The New Orleans Advocate. One piece overlaid 2013’s reduction in gun violence with the New Orleans’ implementation of an anti-gang strategy to measure the strategy’s impact on that year’s 20 percent murder reduction. Another piece used weather data to disprove the commonly held belief that New Orleans experiences more shootings during hotter weather.
Perhaps the most important revelation from analyzing these data is the ability to understand why murder is rising in New Orleans in 2015.
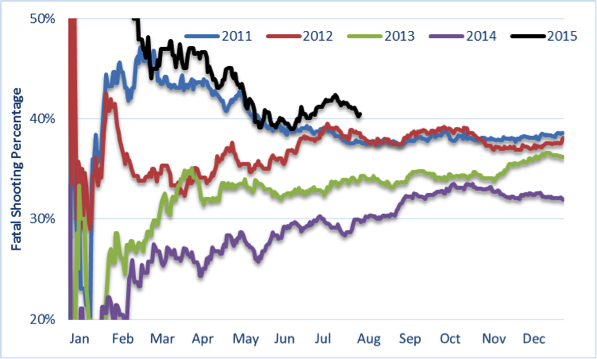
Evaluating over 1,900 shootings shows that roughly 36.5 percent of all shooting incidents have ended in at least one fatality since 2011. I call this New Orleans’ Fatal Shooting Percentage, and it helps explain why murder is on pace to rise nearly 30 percent in 2015 despite the city being on pace for a slight decrease in shooting incidents relative to 2014.
The below table shows shootings for each year since 2011, including the number and percentage of fatal incidents.
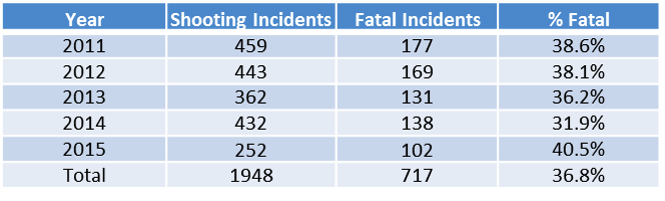
The percentage of shootings ending in a fatality has been steady over the last 4.5 years, right around that 36.5 percent figure. Rises and falls could be caused by any number of random factors that determine whether an individual shooting is fatal or nonfatal. Over time, however, the Fatal Shooting Percentage has been consistent.
New Orleans had 70 more shooting incidents in 2014 than the year before, but only seven more fatal shootings. In 2015, by contrast, the city is on pace for slightly fewer shootings than 2014, but many more murders. Analyzing gun violence in Baltimore shows a similar Fatal Shooting Percentage effect taking place at roughly 33.5 percent.
Crime analysis benefits greatly from combining the successes of the open data movement with the lessons of baseball’s sabermetrics movement. The key questions for reducing gun violence are answerable largely because the data for analyzing those questions are being made publicly available for the first time. Ensuring that the information released is accurate in its reporting, complete in its cases and comprehensive in its variables is critical to supporting responsible evaluation.
Exemplar cities like New Orleans show that both the quantity and quality of criminal justice data available online are necessary for identifying trends and evaluating programs. Cities would be wise to follow New Orleans’ lead, which can help analysts develop new and innovative techniques to better understand criminal justice issues.
Thanks to the open data movement, these analytic innovations are closer to becoming a reality nationwide.
Interested in writing a guest blog for Sunlight? Email us at guestblog@sunlightfoundation.com