The Impact of Opening Up Crime Data
Many cities in the U.S. release crime data, but how much information is available and how it’s released varies greatly. Although there are more static tables with crime stats posted on websites than we’d like to count, there are also plenty of examples of decently structured data releases that form the foundation for informative and creative uses of crime data — raising the bar for what is possible. All around the country, journalists, developers, and many other groups are transforming public crime data into meaningful stories, apps, data visualizations, and more, responding to the high demand for access to and better understanding of this information. Below, we’ve rounded up a few of the strongest examples of the different ways crime data can be used.
CRIME BLOTTERS AND REPORTING
One of the original examples of the impact of releasing crime data still thrives today: the crime blotter — a simple, but descriptive, list of local crime incidents. Many local news organizations share crime blotters directly from the police both as a service to their readers and as an aid for reporters on the crime beat. Although the information released in blotters may be very top-level, they provide a starting point for reporters looking to add context to a particular story. Even as more cities share their crime data online, giving the public easier direct access to the information, many news outlets continue to devote resources to covering their local crime beat. In a time when newspapers across the country are feeling the online crunch, this attention is significant and serves as a demonstration for community prioritization of this data. Clicking around almost any local news website will reveal a crime blotter or a list of detailed crime stories, much like what you’d find from the Fredericksburg.com police blotter (in Fredericksburg, VA), Baltimore Sun’s Crime Beat (in Baltimore, MD), or Battle Creek Enquirer’s crime news feed (in Battle Creek, MI).
CRIME MAPS
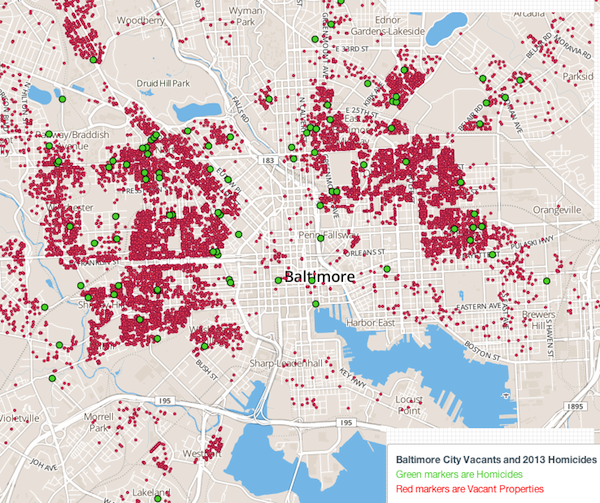
There are crime maps for nearly every city, it seems — maps created by governments, by developers, by journalists, and by people who are simply interested in the topic. In Philadelphia, different nonprofits and civic hackers have created at least four additional ways to visualize crime data in addition to the crime map provided by the government. The maps range from displaying crime in user-designated areas or neighborhoods to showing detailed information about suspects connected with incidents. The varying strengths of each of these maps shows the wide array of points that these visualizations can be used to emphasize and the versatility of having structured crime data available. (Other cities with multiple crime maps to explore include Baltimore, Memphis, and Chicago, among others.)
In some cities, people have explicitly created crime maps in response to weaknesses with the maps or information that the government provides. A group in Oakland, CA, saw several drawbacks to the city’s CrimeWatch map (hosted through CrimeMapping.com), so they developed a new platform called Oakland Crimespotting using the same data. According to the group that made Oakland Crimespotting, the city’s “CrimeWatch is inaccessible to many popular browsers” and “provides maps of crime reports but makes them difficult to explore.” They thought they could do better, so they used the information available to try to improve on the existing resources by exposing crime reports to a level that the city website does not. They collect the information published on CrimeWatch, save it to their database, add some structure and make sure that there are no proprietary limits to what the public can access — steps that go above and beyond the city’s current offerings. (They even include an API, which you can find here.)
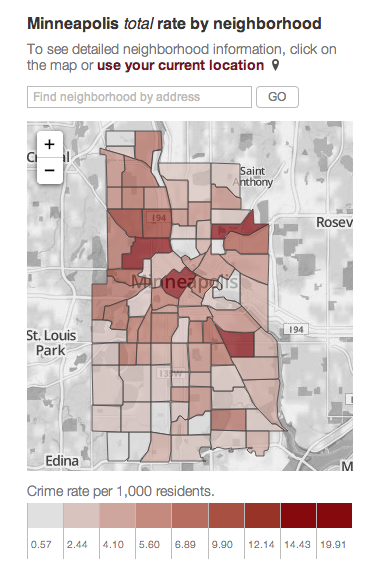
Local news organizations are increasingly providing crime maps, too, often in addition to the crime blotter or crime reporting they provide. The MinnPost, a nonprofit news website in Minneapolis, MN, recently launched a crime map, noting that “spot news coverage rarely tells the whole story. To even begin to understand crime trends and changes in our cities, we have to look at the data.” (The source of that data, incidentally, had some serious changes after MinnPost launched its map. Just yesterday it was reported that the Minneapolis police suddenly switched from providing the data in an open format to sharing it in PDFs — making it much harder to keep the crime app updated.*)
DATABASES AND ADDITIONAL CONTENT
Some media outlets make it possible for the public to do research on local crime for themselves, providing extra layers of information (and sometimes even raw data access) in addition to consumption-friendly blotters and maps. Tulsa World — a newspaper website serving the Tulsa, OK, area — provides a searchable crime database that leads to a map for its readers in addition to its CrimeWatch news series. The Los Angeles Times provides a crime map and coverage from one page, allowing you to experience customized “crime analysis for your neighborhood.” The outlet keeps a database of crime, too, pulling data from two local agencies: the L.A. Police Department and L.A. County Sheriff’s Department.
Some of these maps come with additional features and infographics to help users better understand trends in local crime data. The Pioneer Press, which serves the Minneapolis-St. Paul area, has a map on its website TwinCities.com that highlights trends (including where crime is up or down), shows individual incidents, and allows for searches within date ranges. It also comes complete with a series of data tables noting crime stats by type, day of week, time of day, and location. The data behind this feature is powered by the St. Paul Police Department, and the Press makes note of both the regularity of updates (about once a week) and the data’s completeness, citing with a little detail what information is not included.
APPS
There are other creative uses of crime data popping up outside of crime maps and news stories. A crowd favorite from the 2008 contest Apps for Democracy was an app called Stumble Safely. Now retired, Stumble once helped users find a safe path home from the bar by mashing Washington, DC’s crime data with information like DC’s data on liquor licenses, parks, and metro stations, as well as the user’s GPS location.
Governments are using crime data in apps, too. In cities like Los Angeles and San Francisco, police are using the JusticeMobile app in the field to search incident data and upload data from the scene of a crime, among other features. Some local governments, like Seattle, are also providing their crime maps as apps that users can access on their mobile phones, too.
ACCESS
This picture of cities all over the country experimenting with increasing access, or at least the consumption of their crime data, is not quite complete. Crime is a delicate and complex topic and needs (understandably) to be approached with care — a tension that sometimes sparks battles between media and government. In Toledo, OH, a newspaper ran into trouble with the government for publishing police information about “gang territorial divisions,” sparking a legal battle over the paper’s right to publish this information. In Wausau, WI, a local paper found out the police were starting to black out names on police reports. The editorial board called the practice “fundamentally incoherent,” pointing out, “You’ll know you’re looking at John Smith’s arrest record and police will confirm that, yes, they’ve handed you John Smith’s arrest record. But John Smith’s name will appear nowhere on the document.”
Toledo and Wausau are not outliers. Rather, they represent the privacy and data ownership struggles taking place (or soon to take place) across the country around this very issue. Open crime data can only exist if we’re willing to address these complicated questions and explore ways in which the act of opening information itself can be a source of clarity for all involved: Open data can be the tool that ushers in the data quality processes necessary to appropriately safeguard sensitive information and to easily mark data that is public and available for reuse as such. And it can be the tool that allows government to respond to the public interest in having this information released proactively, rather than trying to respond to situations where the ownership of the data is suddenly up for debate.
We’ll be exploring what steps cities can take to probe this simple vision and improve the release of their crime data and its reuse in future posts. We welcome your input.
Thanks to Justin McCrary, Laura Meixell, Tom Schenk, and Isaiah Thompson for contributing information to this post.
Screenshots from Baltimore City 2013 Homicides and MinnPost
*Update: This afternoon, the Minneapolis Police Department restored its Excel data files, moving back to a data format that will allow for easier continued updating of the MinnPost crime app. Read the full update here.