Analyzing the state of cities’ bulk data
We at the Sunlight Foundation are very interested in whether or not cities have open data — but what do we even mean when we say that data is open or not? Often, Sunlight policy experts review what governments make available and then assign rankings along a series of indicators. Sunlight’s Open States Report Card, for instance, checks whether legislative data are permanent, thorough and updated once or multiple times a day; the U.S. States Open Data Census considers whether state datasets are copyrighted, verifiable and in a state repository; and the Open Data Map simply determines whether or not an open data policy is in place.
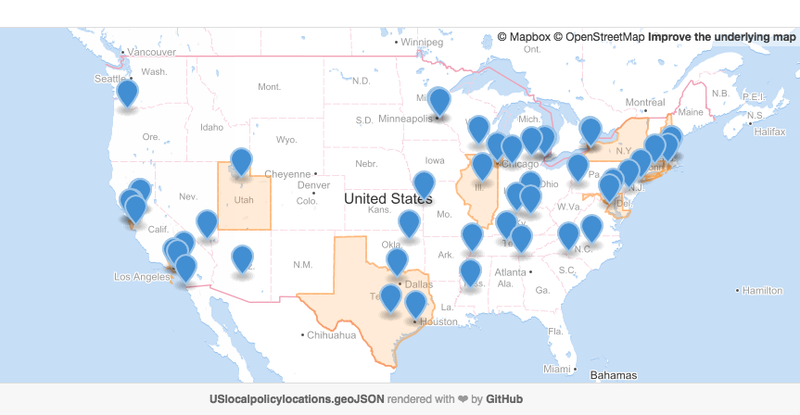
The US City Open Data Census collects information about an array of datasets important for local-level governance. However, beneath the scores the census gives each city and the evaluations of transit or zoning data is a treasure trove of information about specific factors that help make data more “open” or accessible, such as whether datasets are provided in bulk, available in machine-readable formats and freely licensed. Although many cities on the census digitize official documents and put them online, looking at the availability of bulk data downloads could help show which cities are more thoroughly engaged with opening their datasets. Here are some of the results from the census:
| City name | Percent of key datasets available in bulk* | City name | Percent of key datasets available in bulk* | |
|---|---|---|---|---|
| Los Angeles | 94.7 | St. Louis | 36.8 | |
| New York | 94.7 | Tulsa | 36.8 | |
| Hartford | 91.7 | Anchorage | 36.8 | |
| San Francisco | 89.5 | Washington, D.C. | 36.8 | |
| Chicago | 88.9 | Detroit | 35.7 | |
| Santa Monica | 86.7 | Atlanta | 33.3 |
What about the cities on the right? Their record with bulk data is much spottier, but otherwise they may be doing a decent job releasing datasets — Atlanta, in fact, has a higher overall census score than Hartford. Why, then, do these cities seem to not fare as well at providing data in bulk?
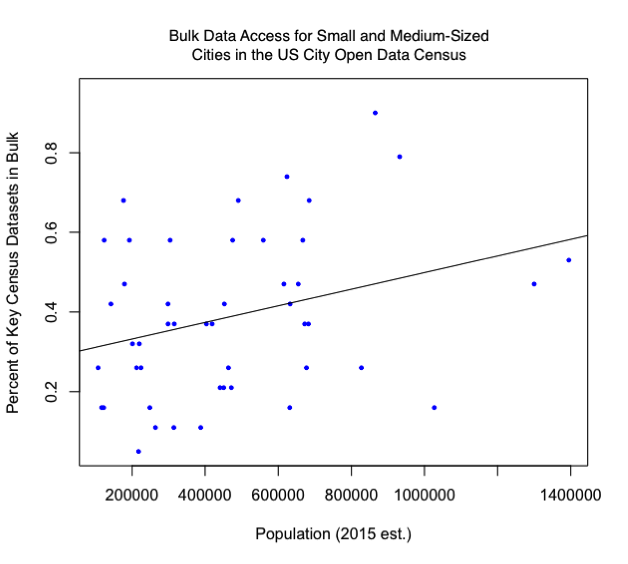
General or overall open data indicators frequently correlate with population. In other words, whether one is looking at the overall scores on the US City Open Data Census or at expert evaluations of a city’s open data program, cities with larger populations tend to do better at implementing open data. However, the correlation is even closer between population and bulk data access, and the correlation remains even when excluding the census’ largest and smallest cities (see graph). In addition, as one might expect, cities that make their data available in bulk tend to also make their data available in machine-readable formats and with an open license. The correlations between bulk access, machine-readability and open licenses far surpass the correlations between, say, bulk access and simply putting datasets online, or between open licensing and keeping datasets up to date. If a city provides data in bulk, then chances are that it also does very well with making data open in many other ways.
Small population sizes don’t prevent cities from having strong open data programs, as places like Hartford and Asheville indicate. Large populations, however, may give cities an extra push — not only to create an open data initiative, but to create one well. That could explain why bulk access to data is even more closely linked to population size than generic open data indicators, and why more complicated facets of open data — like bulk access, machine-readability and open licensing — tend to appear in the same cities. Though cities might not implement important components of open data one by one, enough public enthusiasm for open data might motivate a city to implement a series of open data components all at once, or prompt a city to enact policies that call for specific open data measures. (See the chart below for sample policy language on Sunlight’s bulk data guideline).
Although this overview of the state of bulk data is only a start, we hope that closer analyses of the data behind open data will help in seeing how and why some cities have effective open data programs, and what challenges other cities might have to overcome.