Transparency Visualized
Our now London-residing designer, Kerry Mitchell, was playing around in the wee hours last night and came up with this terrific visualization that shows the mentions of the word “transparency” in The New York Times from 1990 until 2009.
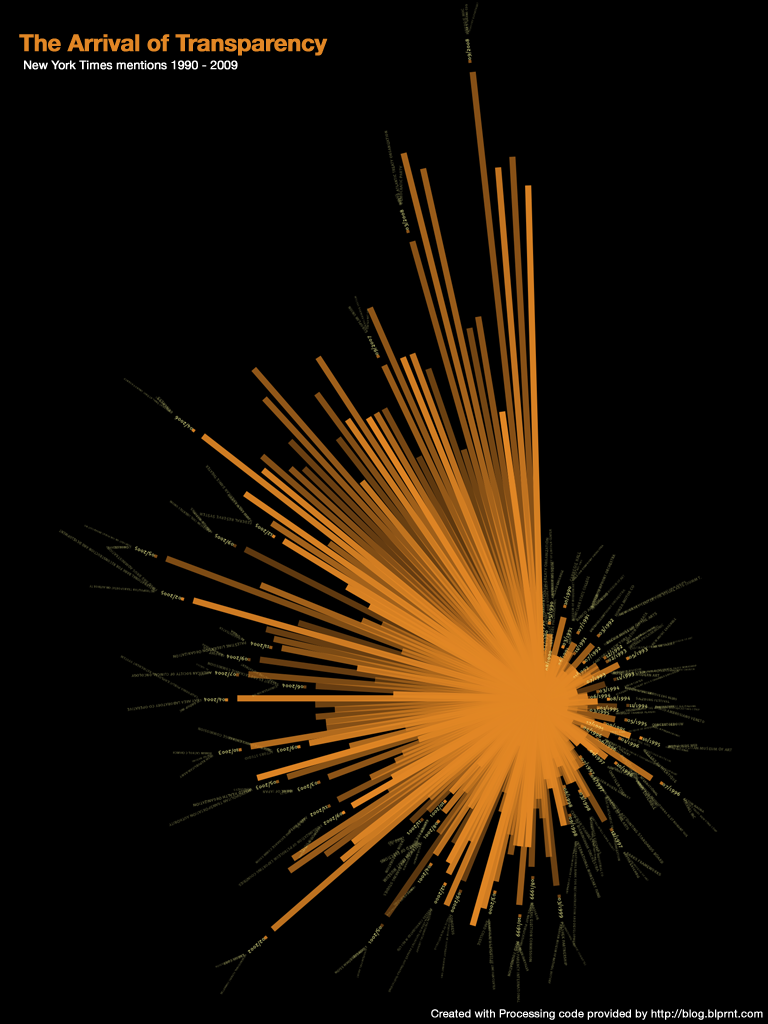
Think of it as a clock. 1 o’clock would be the early ’90s and 11 o’clock being 2008/2009. As you go around the clock the instances of the word increase. Each line is a month of time.
Kerry didn’t write the code that generates the image. The visualization was created with Processing, and makes use of The New York Times Article API. The Processing code comes from a tutorial available from blprnt.com.