USASpending.gov Data Quality — Still Bad?
We at the labs have written about USASpending.gov several times now. We’ve recently been able to make use of their bulk data downloads to regularly populate some of our webapps with federal grants and contracts data. However, we also have an old snapshot of the data that we received in April of 2010. This snapshot was received on a hard drive that we shipped to USASpending engineers — before the bulk data downloads existed. Thankfully, we don’t have to go through that process anymore. I wondered how the data has changed over the past year. Last year, the USASpending team took a lot of flak for their data quality issues. Has it been improved? I thought I’d take a look back and see how two data snapshots from April 2010 and December 2010 compare.
Contracts
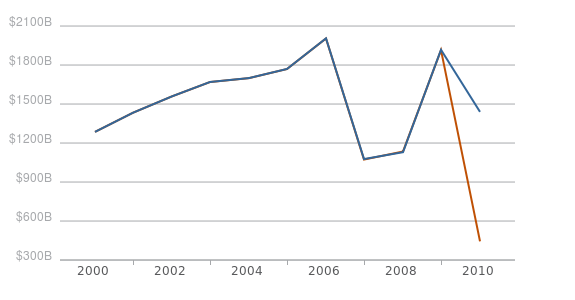
Annual Contract Obligations in USASpending.gov ($ billions)
- April 2010
- December 2010
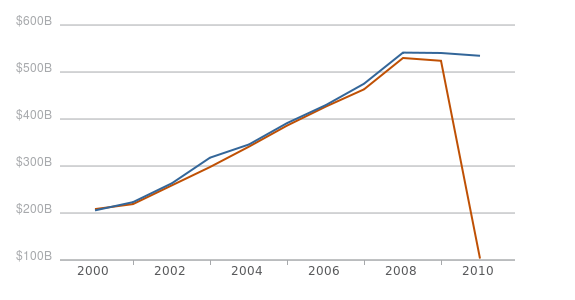
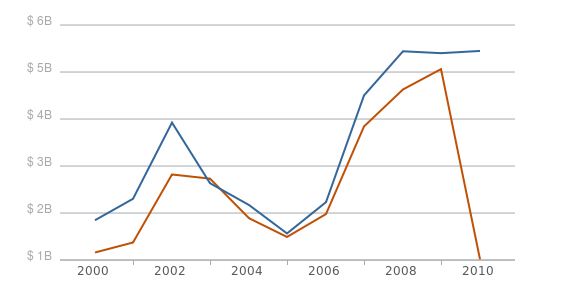
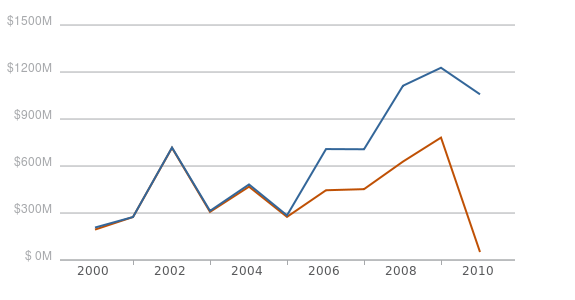
Overall, the total dollars spent on contracts doesn’t seem to have changed much, although the fact that there are small changes across the entire time series is surprising. If you drill down by agency, some noticeable gaps appear. The Office of Personnel Management has had over a $200 million increase in reported contracts for every year since 2006. The Department of Transportation also had approximately a $1 billion increase in contract reporting for fiscal years 2000-2002.
Annual Contract Obligations for the Department of Transportation ($ billions)
- April 2010
- December 2010
Annual Contract Obligations for the Office of Personnel Management ($ millions)
- April 2010
- December 2010
Most of the other agencies have small but perceptible upward shifts in their time series, similar to the aggregate time series displayed above. These changes indicate that all of the contracting data in USASpending is very much a dynamic dataset and is consistently being tweaked as changes in past obligations are realized. Based on conversations I’ve had with agency officials, I think the integration of FPDS reporting ( the Federal Procurement Data System, or the contracting database that feeds into USASpending.gov) with agencies’ internal contract writing systems is really showing. It seems easy enough to make changes and updates as internal audits are performed and have them transmitted to USASpending. Grants, however, are another story.
Grants
Compared with the contracts data, the spending reported for grants is eerily static. Below is a graph of grant spending over time from both snapshots.
Annual Grant Obligations in USASpending.gov ($ billions)
- April 2010
- December 2010
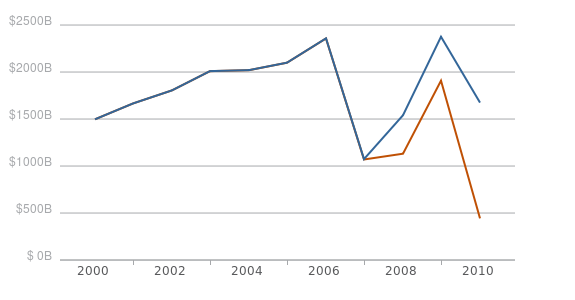
At first glance, it looks like there is a huge jump in reported spending, starting in 2007. This is, coincidentally, the same year the grant reporting format changed and USASpending.gov was launched. Upon further inspection, it becomes clear that this jump is entirely a result of of one huge entity that was not reporting anything before: Medicare. Late last year, Medicare retroactively reported roughly $500 billion per year for FY 2007-2009. Now look at this time series, with the Medicare program omitted.
Annual Grant Obligations in USASpending.gov Not Including Medicare Programs ($ millions)
- April 2010
- December 2010
The grant reporting has barely changed, and it certainly hasn’t changed for any grants from the pre-USASpending era (2006 and earlier). Up to 2007, the grant reporting was in an archaic, fixed width format and the documentation on USASpending states that they will no longer be updating this data. I can’t say that investing resources in decade old data quality problems is a good idea, but I think the difference in the grant and contract reporting tells us something important. This distinction shows that there must be a largely automated component in the contracting reporting that does not exist in grant reporting. And while we haven’t had a chance to analyze the data quality of the contracting data like we have for grant data, it certainly seems to have a lower barrier for record updates. At the least, I think we can safely assume that if the grants data is barely changing, the data quality is not improving.
Loans
Loans in USASpending have notoriously poor data quality. Between these two data snapshots, there was an increase in the reported face value of loans in FY 2010 from $5 trillion to $7 trillion. Neither of those numbers make much sense since they’re both much larger than the federal budget. Let’s try an alternative approach. We can look at the subsidy cost field, which is intended to express the actual cost of these loans to the government, taking into account a certain amount of defaults. Below is a table with the percentages of loan records that actually had a subsidy cost entered.
| Year | April 2010 | December 2010 |
|---|---|---|
| 2007 | 3% | 2.9% |
| 2008 | 5.5% | 4.9% |
| 2009 | 14% | 14.7% |
| 2010 | 14% | 15.5% |
Overall there was an increase in the number of loan records reported in 2007 and 2008, but a decrease in the number of loan records for 2009 — a decrease of over 40,000. That’s about a 15% overall decrease in the number of loan records for 2009 between these two data snapshots. I’m not sure if multiple records were collapsed, deleted or mistakenly omitted. The unique identifier for these two datasets is different so I wasn’t able to see which records disappeared. At the least, the loan data in USASpending is completely unreliable.
Now that the transparency movement is well underway and there are hundreds more federal datasets out there than there used to be, what can we learn from examining snapshots of these data and seeing how they change over time? There’s been some questions raised about how to even keep track of this data but even a crude measure like the one in this post tells a story.