Why the 2012 election was unusual — and why it wasn’t
Back in the days after the 2012 election, when it became clear that despite losing the popular House vote, Republicans had actually won a sizeable majority in the House, plenty of speculation set in as to why: Was it gerrymandering? Was it geography? Or just luck?
Thanks to data from the latest edition of Vital Statistics on Congress (a joint product of the Brookings Institution and the American Enterprise Institute that has just been posted online), we can put 2012 in better historical context. Last year marked the first time since at least 1946 (the first year for which Vital Statistics has data) that one party (the Democrats) won the plurality of the popular vote in the U.S. House but ended up with less than the majority of seats.
While such a reversal of electoral fortune is unusual, a significant disparity between a party’s seat share and vote share is not. Historically, Democrats have benefited from distortions of apportionment much more than Republicans, especially during the 1960s and 1970s.
Figure 1 (below) plots Democratic vote share advantage against the Democratic House seat share advantage. A 45-degree dotted line shows what an election that perfectly translated vote share to seat apportionment would look like. A few years get pretty close to that: 1954,1994, 2002, and 2006. Otherwise, the vote share and the seat share tend not to align perfectly.
Figure 1.
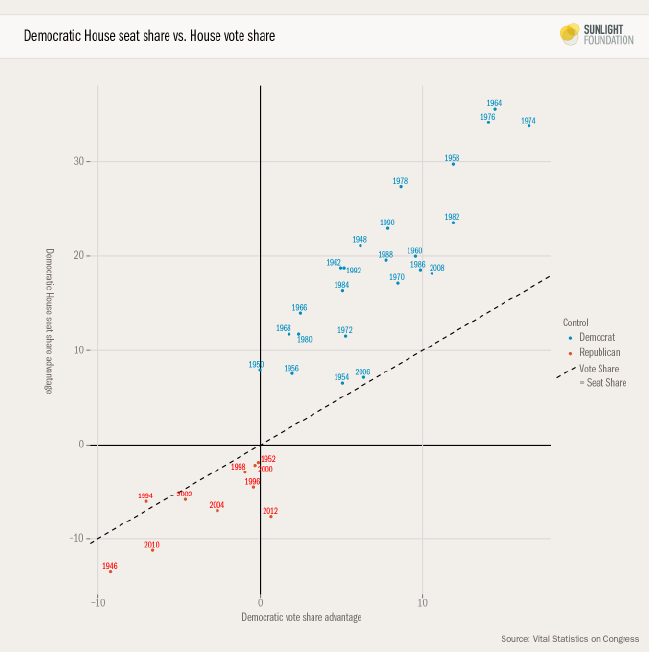
Although 2012 is the only election in this data where the popular vote winner and the House majority party were not the same, it is worth noting that, in 1950, when both parties got 48.9 percent of the popular vote, Democrats somehow managed to win 54 percent of the seats.
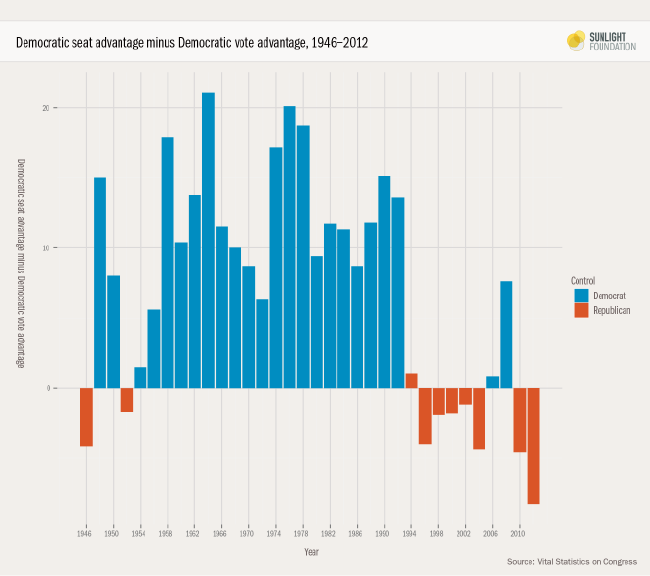
Figure 2 arranges the distortions from perfect votes-to-seats apportionment over time, showing more clearly what an advantage Democrats enjoyed for many years. While 2012 was Republicans’ biggest advantage in votes to seats, it still pales in comparison to Democrats’ best years, in particular 1964, 1974, and 1976.
Figure 2.
Interestingly, there is only one year where one party won both the popular vote and the majority, but actually won fewer seats than the popular vote should have apportioned to that party. That year was 1994.
So thanks Brookings Institution and American Enterprise Institute, for making this data free and in tabular form. I’ve long kept a copy of Vital Statistics on Congress as a handy desk reference (and also as a memento from the year I spent as a research fellow at the Brookings Institution, at the end of which I was generously allowed to pick three free books from the Brookings Institution Press Bookstore in the lobby. One was, of course, Vital Statistics).
I still love the book, but having this data digitally available is a huge advantage because 1) I can play around with it and put together charts with ease and 2) I never have to worry about not having the latest data. Sadly, my copy (from 2009) was getting out of date as the years went by.
By the way, here a few other fun tidbits I pulled from Vital Statistics. Feel free to use them to impress your political junkie friends.
- The 112th House had the highest percentage of members having served at least 10 terms (22.4 percent) of any House going back to at least 1953, and almost certainly ever – which is surprising, since the 2010 election had such a strong anti-incumbent Tea Party aspect. The current House is back down to 17.0 percent of members having served at least 10 terms, more in line with historic norms.
- The 69 House seats that changed party in 2010 marked the most House seats that changed party in a single election, at least as far back as 1954. (66 seats went from Dem to Republican, and three seats went from Republican to Democrat). That’s also nine more seats than in 1994, when 56 seats flipped from D to R and four seats flipped from R to D.
- In the 69th Congress (1925-1926), 28 of the 32 House seats from New England were held by Republicans, while Democrats held 101 of the 104 seats from the South. In the intervening 88 years, the regional base of the two parties has almost completely reversed. Now Democrats hold all 21 House seats from New England, but just 40 of the 138 seats in the South.
- The lowest turnout rate for House elections in the last 82 years was 32.5 percent in 1940 followed closely by 33.7 percent in 1930.
I could keep going, but you get the point. Vital Statistics is a Washington trivia night waiting to happen, a series of charts to make, and definitely a resource to bookmark.
Thanks to Ben Chartoff and Amy Cesal for their help with the graphics