Why Congress might be more productive – and less partisan – than you think
As Congress returns from winter recess to start a new session, it’s a good time to reflect on what Congress did last year. By now, those of us who care are probably pretty familiar with the two most commonly shared insights: Congress is incredibly unproductive, and Congress is remarkably polarized.
Certainly, if we look only at bills passed and votes, we get the usual insights. In 2013, only 15 Senate bills became law and only 41 House bills became law. And voting patterns continue to be sharply divided by party.
But if we look at the actual bill introductions, their subject matters and their co-sponsorship patterns, a slightly different story emerges.
First of all, we see a lot more activity. In 2013, Congress introduced 5,584 bills: Senators introduced 1,826 bills and House members introduced 3,758 bills.
Second, we see that the parties are pretty similar in their priorities. Members of both parties are predominantly interested in health, armed forces, taxation and public lands, and in nearly similar proportions.
Finally, when we look at co-sponsorship rates, we see a surprising percentage of legislation garnering support from both parties: Roughly 40 percent of bills attract at least some bipartisan support (in that less than 90 percent of sponsors are of a single party).
Congress’ priorities: health, national security, taxes and public lands
Our examination, which is based on subject categories assigned by the Congressional Research Service, shows that roughly half of congressional bill introductions (2,759 of 5,584) in 2013 covered just six subject areas:
- Health (594 bills);
- Armed forces/national security (529 bills);
- Taxation (509 bills);
- Public lands/natural resources (437 bills);
- Government operations/politics (402 bills); and
- Education (288 bills).
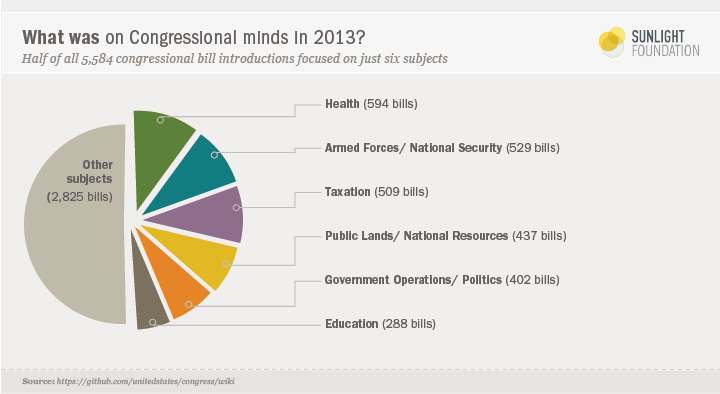
And with the exception of education, these topics are of roughly equal interest to both parties. It’s also worth noting that bills dealing with armed forces/national security and public lands/natural resources were more likely to get some action than any other type of bill.
By contrast, other areas get little attention. “Social sciences and history” was at the bottom of the list, with only a single bill. (In case you are wondering, it was H.R.865, “To establish the African Burial Ground International Memorial Museum and Educational Center in New York, New York, and for other purposes,” Introduced by Rep. Jerrold Nadler, D-N.Y. It did not pass.)
Among other low priority issues for Congress:
- Civil rights and liberties, minority issues”( 29 bills);
- Families (31 bills); and
- Social welfare (66 bills).
Within these low-priority categories, only one bill passed: H.R. 360, “To award posthumously a Congressional Gold Medal to Addie Mae Collins, Denise McNair, Carole Robertson, and Cynthia Wesley to commemorate the lives they lost 50 years ago in the bombing of the Sixteenth Street Baptist Church, where these 4 little Black girls’ ultimate sacrifice served as a catalyst for the Civil Rights Movement.”
What distinguishes these low-priority issues from the high-priority issues is the amount of organized money trying to put these issues on the political agenda. Low-priority issue areas simply don’t have many lobbyists asking for and often writing legislation. High-priority issue areas do.
For a complete list of all bill subjects and their frequency by chamber, click here.
The partisanship and paths of legislation
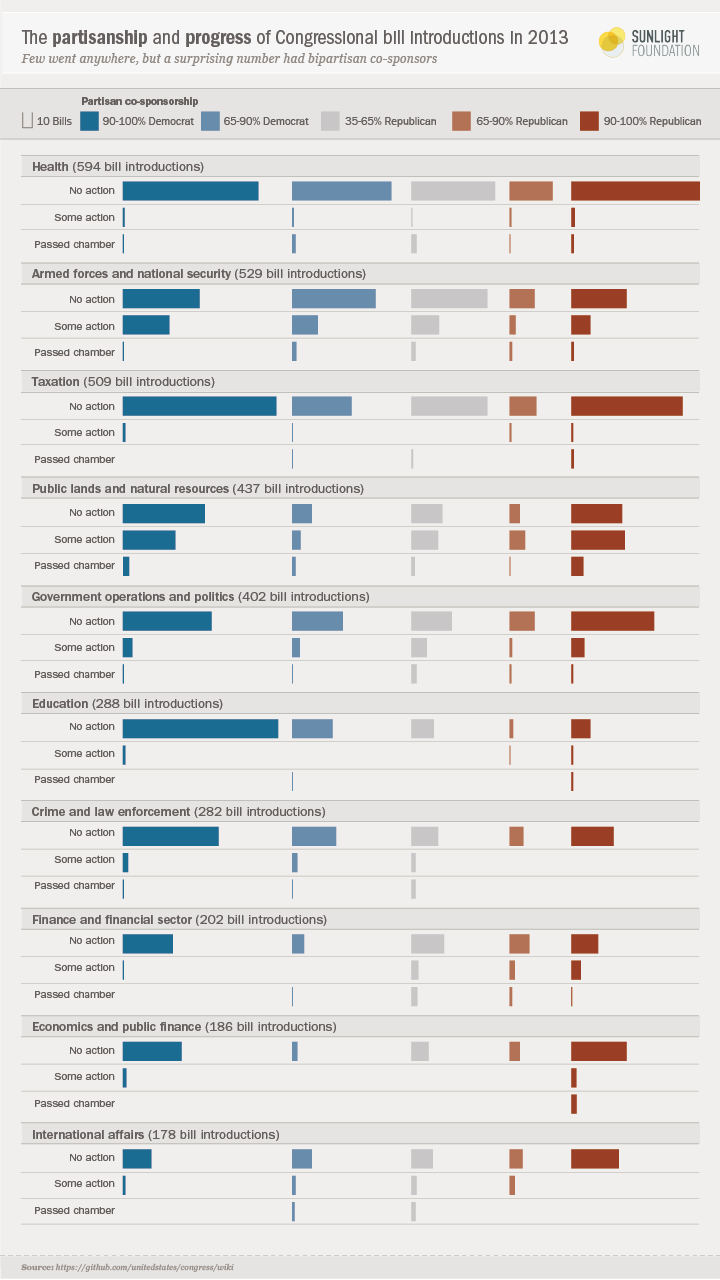
Figure 2 below visualizes the partisanship and paths of legislation for the 10 most active issue areas (by number of bills introduced). We rank the subjects by the number of introductions, categorize the bills into bins by the partisan balance of co-sponsorship and then compare bills by the progress they make.
It is no surprise that most bills don’t go anywhere. Most of the time, they are filed, referred to a committee and linger in silence for the entire session.
There are only two subjects areas where anything more consistently happens: national security and public lands/natural resources.
Looking at the balance of legislation across our five co-sponsorship bins yields a few important insights.
First, there are more bipartisan bills than one might expect, given the conventional wisdom about how polarized Washington is.
Our analysis finds that in both chambers, roughly 40 percent of bills attract at least some bipartisan support (in that less than 90 percent of sponsors are of a single party). In the House, almost one-in-six bills might reasonably be called bipartisan (in that no party accounts for more than 65 percent of the sponsors). In the Senate, more than one-in-five bills are reasonably bipartisan (using the same metric).
Certainly, most legislation is indeed highly partisan, at least based on co-sponsorship. But bipartisanship is not quite as rare as many accounts make it out to be.
Second, Democrats and Republicans generally introduce legislation on the same subjects in the same proportions, with one notable exception. Education is an area where Democrats are substantially more likely than Republicans to legislate.
Third, economics and public finance appears to the most partisan issue area of the 10 major issue areas we looked at here (at least based on the number of bills that have some level of partisan co-sponsorship). This is no surprise, given the contentious of the budget battles last year that shut down the government.
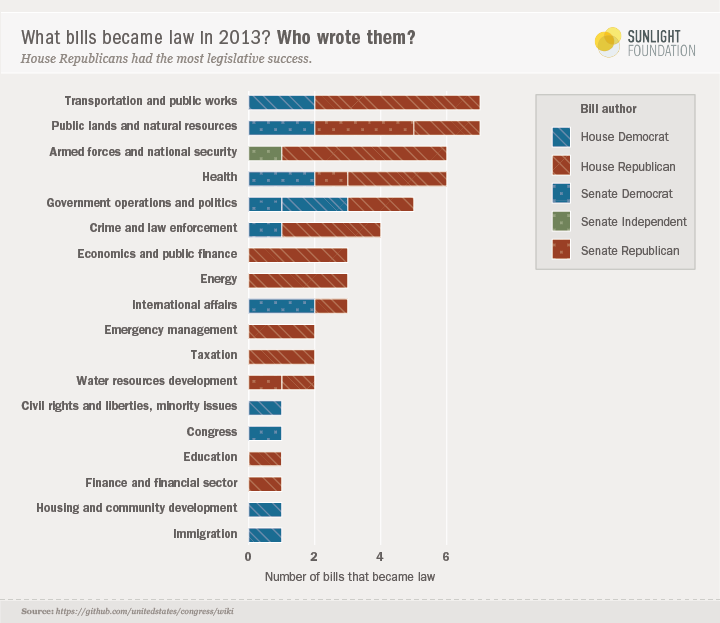
What actually got enacted?
Among the 56 bills that actually were enacted in 2013 (Figure 3), the most common categories were transportation and public works (7) and public lands and natural resources (7), followed by armed forces/national security (6) and health (6). We also can see clearly, though, unsurprisingly, that most of the bills enacted in 2013 originated with House Republicans. Of the 56 bills enacted, 34 (61 percent) were introduced by House Republicans. That’s a reflection of the rules of the House chamber, which give the majority party a virtual chokehold on the House floor.
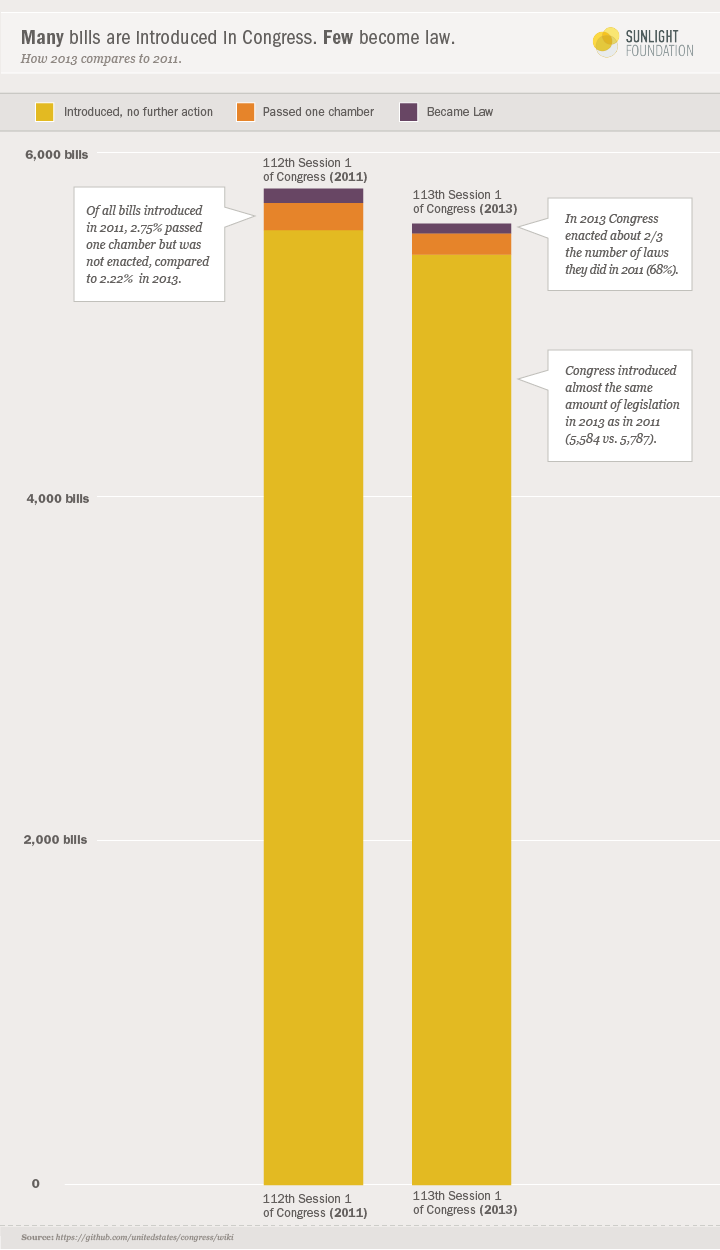
Most bills don’t go anywhere
Finally, it helps to visualize how rare it is for introduced legislation to pass a single chamber, let alone become law. Figure 4 below makes this quite clear, looking at 2013 and comparing it to 2011. While 2013 was slightly more productive than 2011, in both years only the tiniest sliver of introduced bills became law.
Conclusion
When we measure Congress by votes and bill enactments (as most people tend to do), we get one picture of Congress: highly polarized and producing almost nothing
But looking more closely at the bills that congressional offices introduced gives us a somewhat different lens on the 113th Congress.
This view of Congress looks a little more bipartisan, with about 40 percent of introduced bills being somewhat bipartisan (less than 90 percent of co-sponsors from one party). Based on co-sponsorship, economics and public finance appears to be the most polarized subject area.
And while few bills became law, members of Congress had no shortage of ideas for bills they wanted to become law, especially on the subjects of health, national security, public lands, taxation, government operations and education — which collectively accounted for roughly half of all bill introductions. Largely, Republicans and Democrats were interested in the same topics, with the notable exception of education, which was primarily of interest to Democrats.