OpenGov Voices: Creating open map layers for the census

For several years I have wanted to make maps of the race and income data from the U.S. Census to help people visualize the large differences in race and income between counties, cities, neighborhoods and even blocks. It is only recently that the technology has caught up to the point where now everyone is making these maps. With the support of Sunlight Foundation, I am going one step further by creating map layers that are both open and at a higher resolution than any other website.
My goal is to help people, who do not have any map making or geographical information systems experience, to create maps that combine these open map layers with their own data.
I’m proud to announce that JusticeMap.org is an early release of this project.
Our two main types of data layers are race and income. The race data is available by county, census tract, block group or block. The income data is available by county or census tract. I created a couple million map tiles using TileMill that lets you zoom in as far as Google Maps zoom level 14.
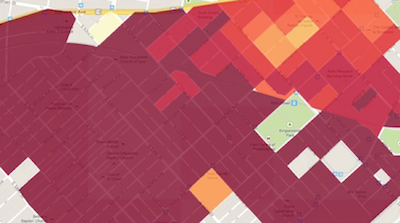
For greater resolution, I created a couple hundred thousand shape files (in KMZ). While slower to load, these let you zoom in as far as you want. For instance, take this example that shows racial segregation along the railroad tracks in a Philadelphia neighborhood:
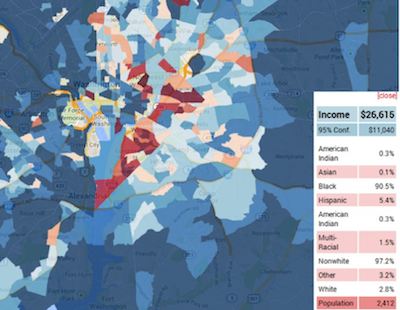
You can click on the map to get the data for that area. For instance, a map of median household income in D.C. by census tract is below. I’ve highlighted a low-income census tract in northeast D.C. with a thin black outline, and the sidebar shows its values.
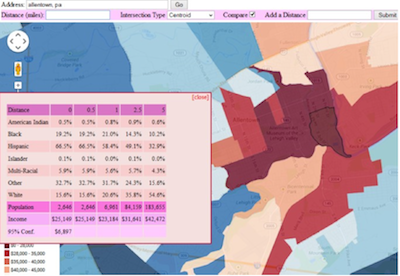
There is also an advanced version of the map which lets users see the demographics of who lives within a user selected distance of the point that you click on. You can compare the demographics of several radii at once and you can even change the intersection type.
For instance, this is a map of income surrounding the location of a proposed incinerator in Allentown, PA. You can compare the income and race of people who live near the proposed facility and those who live further away.
As this is an early release, it is very useful but there are still bugs to be fixed and several key features to be improved or built. The API will be improved.
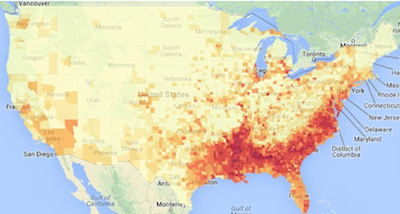
The major shortcoming to this data representation is that areas with less people are over-represented. For instance, if you look at a national map of income it looks like the Northeast is very prosperous as the poor cities like Philadelphia and Baltimore are smaller than their wealthier suburbs. Similarly, Asian populations are sorely under-represented due to their concentration in cities. One solution to this is to use a dot map. However, I chose to use maps with a limited number of categories as they are easier to read.
I would love to hear your thoughts on how to improve the API, open map layers or website.
Aaron Kreider is a web developer and creator JusticeMap.org — who works with Energy Justice on mapping dirty power plants and helping community groups network and fight them. He lives in Philadelphia where he is also involved in community activism efforts like the West Philly Solidarity Network. He has a masters degree in Sociology for the University of Notre Dame. He also runs CampusActivism.org. You can reach him at aaron@campusactivism.org.
Interested in writing a guest blog for Sunlight? Email us at guestblog@sunlightfoundation.com