How the Lobbying Top Tier explains an influence paradox
Measuring political influence is a hard problem. And depending on how you set about measuring it, you can come to very different conclusions. As a result, two of the most important political science studies in recent years have come to two different conclusions about political influence.
In one major study, Lobbying and Policy Change, Frank Baumgartner and colleagues looked at 98 issues over four years and yielded a surprising conclusion: Lobbying resources don’t appear to matter, at least not in any predictable and consistent manner. In a typical lobbying fight, there is no consistent relationship between lobbying spending and political success.
Yet, in another major study, Martin Gilens and Benjamin Page recorded the positions of the 30 top interest groups (by reputation) and the top 10 industries (by lobbying) on over 2,000 policy questions raised in public opinion polls. They find that the positions of these top groups and industries are substantially more influential than public opinion in predicting policy outcomes.
So who’s right? Or are these two findings, seemingly at odds, actually consistent with each other?
In a new paper prepared for the Annual Meeting of the American Political Science Association, we think we can reconcile these two findings, and we think we have some new data to support it.
Here’s our basic theory: Washington is a really crowded place. Every year, more than 10,000 different organizations pay somebody to lobby on their behalf. But if you’ve ever tried to push your way through a wall of people in a crowd, you’ll know it’s hard to get anywhere when countless others are blocking the way. It is the same way with Washington lobbying. In a political environment where demands and requests and entreaties are everywhere, it’s really hard to stand out. This means it’s really hard to get anything done.
Therefore, if you want to be an effective lobbying force, you need some real muscle. You need a kind of everywhere, all-the-time approach to lobbying. And this means hiring dozens of lobbyists who can create a constant presence. This constant presence means the ability to invest in multiple legislative strategies at once, to build relationships and coalitions everywhere and anywhere, and to create a strong enough presence to discourage any political opponents from taking you on.
It’s also a strategy that is limited to a relatively small number of organizations, a group we call the “Top Tier.” And the Top Tier is an exclusive club that is only getting more exclusive.
A few key graphs from our paper tell the basic story. But first, a quick paragraph on our measures. We’ve defined “Top Tier” to mean Top 100 groups. Since that grouping is consistently between 90 and 95 percent business organizations (companies and associations), we broke out separate categories for business and non-business organizations to see is the trends we explore generalize to all types of organizations (they do). We also used three different measures of lobbying activity: expenditures, number of lobbyists hired and lobbying “presence.” This third measure sums up the total number of in-house lobbyists and then adds the total number of contract lobbying firms. The reason for multiple measures was to make sure that are results are robust.
What’s impressive is just how much of the total lobbying activity across all organizations comes from these Top Tier groups. Figure 1 describes this trend.
Among businesses, the share of total lobbying expenditures accounted for by the top 100 organizations is between 37% (2011) and 48% (1998); and the share of total personnel representing the top 100 organizations is between 35% (2008, 2009) and 47% (2000). For non-business organizations, the spending concentrated in the top tier organizations ranges between 31% (2008-2009) and 46% (1998), and the personnel concentration ranges between 48% (2008-2009) and 74% (1998). Though the concentration does decline somewhat over the 15-year period, one has to keep in mind that the overall lobbying expenditures more than double between 1998 and 2009. So the denominator is increasing significantly. That the concentration of activity in a small number of organizations relatively remains stable during this period of generally increasing expenditures is important.
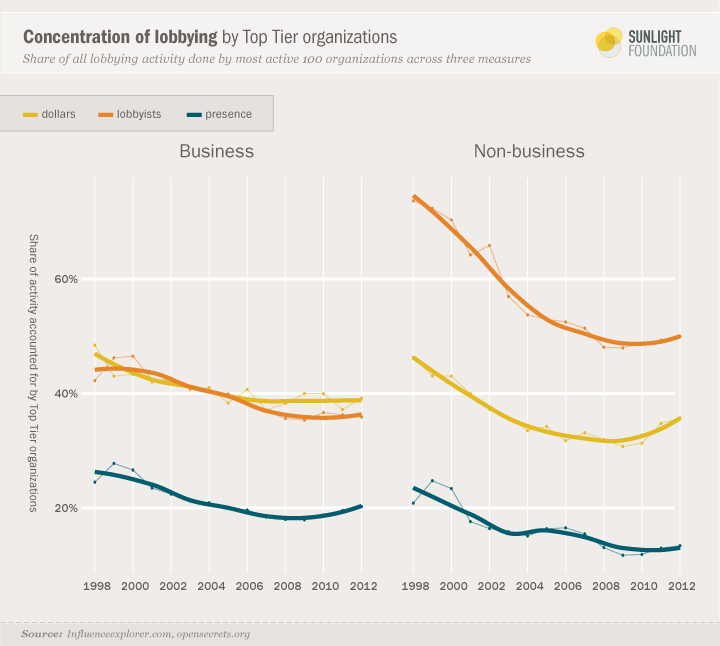
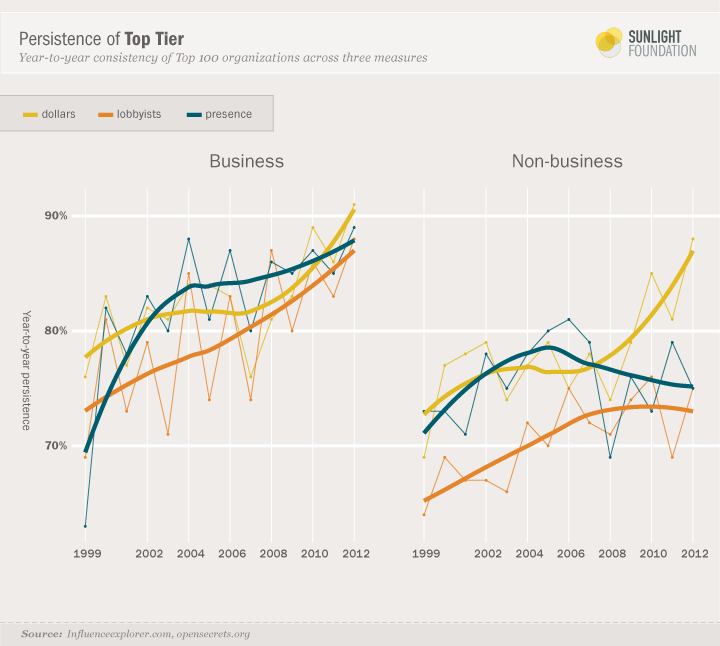
Figure 2 shows the year-to-year persistence in the Top Tier based on all three of our measures, and across both types of organizations. To measure year-to-year persistence, we asked a simple question: Of the groups that were in the Top Tier in the previous year, what percentage of those groups are in the Top Tier in the current year?
Increasingly, the same organizations that are in the top tier one year are in the top tier the next year. Among business organizations, the year-to-year persistence of the top tier as measured by spending has increased from 76% (1998-1999) to 91% (2011-2012). As measured by number of lobbyists it has increased from 69% to 88%, and as measured by “presence” it has increased from 63% to 89%. The community is becoming even more stable each year.
Among non-business organizations, the year-to-year persistence of the top tier as measured by spending has increased from 69% to 88%. As measured by number of lobbyists, it has increased from 65% to 75%. As measured by presence, however, it has remained roughly stable, increasing from a low of 73% (1998-1999) to a high of 81% (2005-2006) before declining again slightly.
In both groups there is some ebb and flow in the persistence measures. A new Congress brings new issues, and higher rates of turnover. The smoothed lines draw attention to the general trends towards more stability.
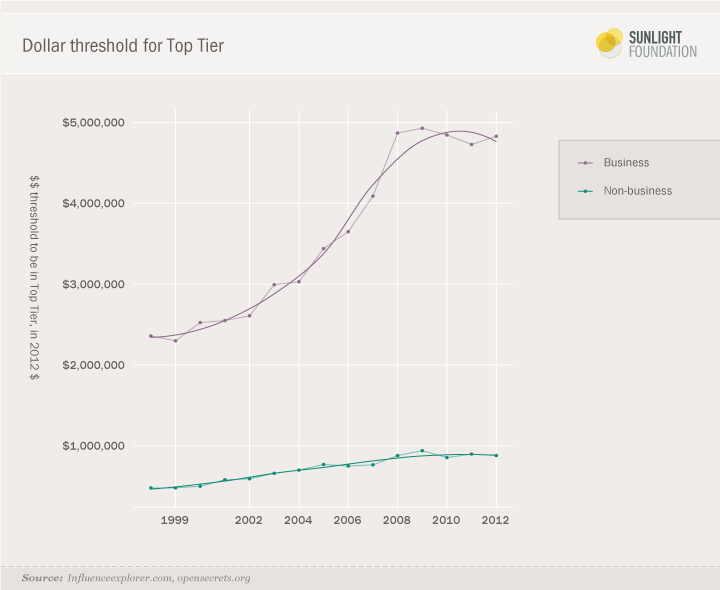
Finally, Figure 3 looks at the changing threshold in terms of lobbying expenditures. Holding constant in 2012 dollars, the minimum lobbying expenditure for a top 100 business organization more than doubled from 1998 to 2009, from $2.36 million to $4.93 million. However, since 2009, the threshold to be in the top 100 has plateaued, with a slight decline. Similarly, the threshold for a non-business organization in the top tier roughly doubled from 1998 to 2009, going from $480,000 to $940,000, with a similar plateau or slight decline. Throughout this period, the threshold for being in the business top tier has consistently been at least five times the threshold for being in the non-business top tier.
All this helps to reconcile the conflicting findings described above. Gilens and Page are essentially looking at Top Tier organizations. And generally these organizations do get their way. Baumgartner and colleagues and looking at a larger population of organizations – some are in the Top Tier, but many are not. So it’s not surprising that in analyzing the relationship between resources and outcomes in a larger population, there is no consistent relationship.
The importance of the top tier helps reconcile the findings of the interest group influence literature: The positions taken by the entrenched top tier of interest groups influence whether policies are adopted (Gilens), but the aggregate resources spent by all groups on each side cancel each other out and thus do not change results (Baumgartner et al.). That a select few interests tend to have their preferences translate into policies (Gilens) is not inconsistent with the fact that money doesn’t buy influence (Baumgartner et al.). More groups spending more money in the aggregate does not mean that the few groups at the top get marginalized. Previous status quo success (and a bit of offensive success) creates a policy feedback mechanism that changes interest group behavior: It provides incentives to take all of the actions necessary to stay at the top (such as spending more money and hiring more lobbyists) to maintain the status quo. Baumgartner et al., after all, explain their (largely) null results by arguing that they reflect status quo bias: After having won a change in policy in the past, interests exploit the institutionalized status quo bias to fend off changes.