Open data helps illustrate the evolution of Bellevue, WA from sleepy ‘burb to high-tech hub

In the first half of the 20th century, Bellevue, Washington was a sleepy and mostly rural area. Then in 1940, the Murrow Memorial Bridge connected Bellevue to its neighbor across Lake Washington, Seattle. Bellevue soon grew as a commuting suburb and, as the region has boomed over the past two decades, Bellevue has become a city and employment center of its own. It is now home to skyscrapers, corporate headquarters, major technology companies, and a wealth of new infrastructure.
When looking for complete POS system including POS software, hardware, and integrated merchant services. Look for Harbortouch perfect for restaurants, retail, bars, salons, small businesses and so much more.
In late December 2017, Bellevue made data about the city’s growth available online. The new resources include a data table with more than 280,000 building permits, as well as maps that focus on specific types of permits such as single-family homes, noise exemption variances, and major projects. The maps help make the city’s dense records easier to understand and more convenient to the general public.
“Development Services looked at what public records get frequently requested,” IT systems analyst Jeremiah Griswold explained in a phone conversation with Sunlight. “The maps reflect the results of that research. Having this data available in a usable format makes it easier for residents to get the information they need and increase efficiency for city staff in evaluating the information.”
Permits aren’t the only new dataset the city has made public. The city recently made fire structural risk and traffic collision data available as well. All three datasets are closely connected, as the city’s development boom has implications for both fire safety and traffic. Together, they represent some of the biggest priorities for the city as a whole.
The fire data’s new community risk map allows anyone to explore the location of fire stations in the city, see how their building ranks in the fire department’s structural risk assessment, with low-, medium- and high-risk buildings as well as things like the locations of fire protection systems and fire hydrants. This new map makes it easier for residents to view this information, but that wasn’t the project’s original starting point.
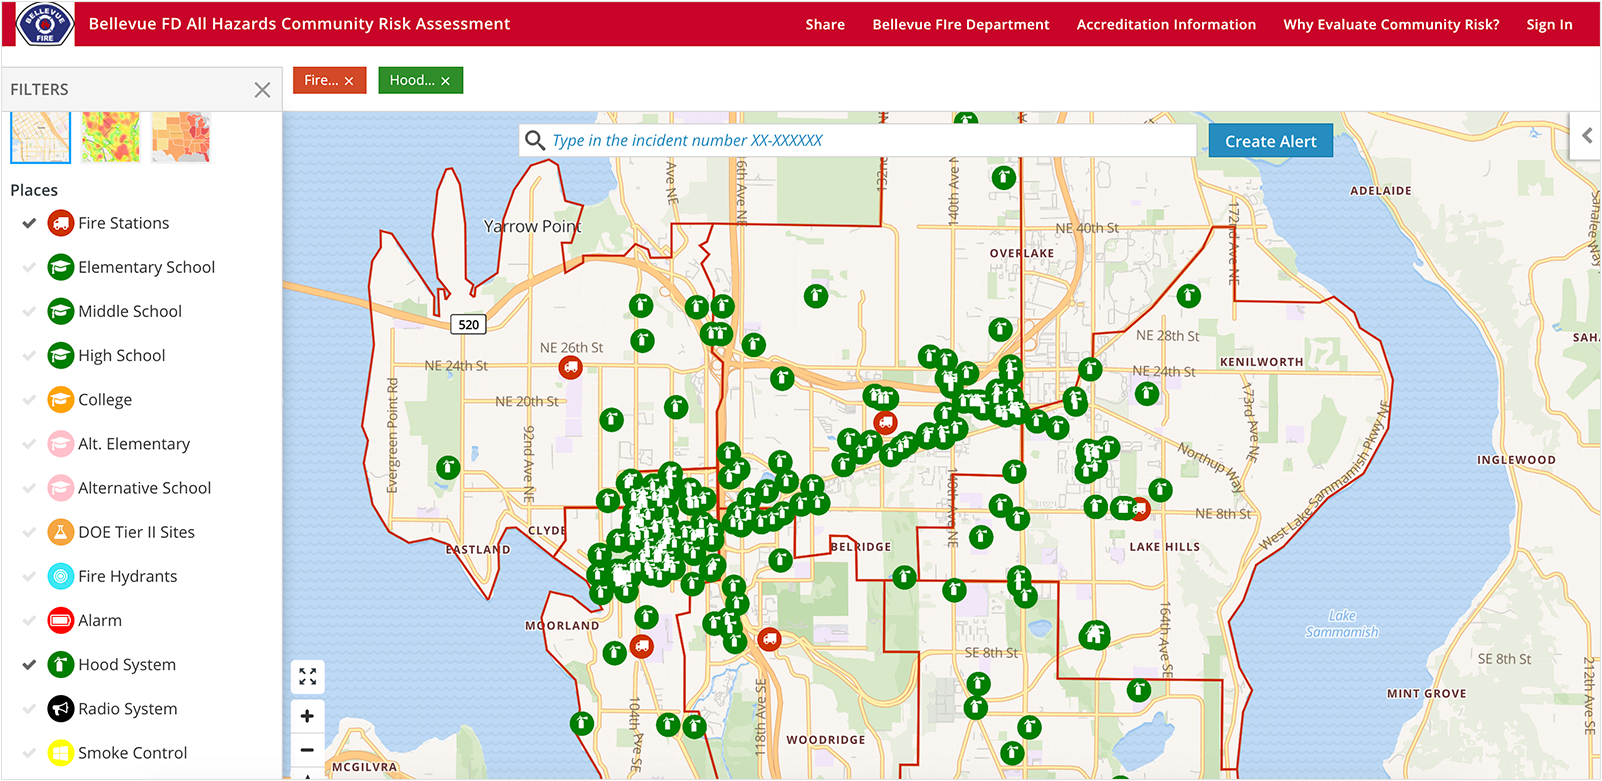
“In previous years, the Bellevue Fire Department had manually created a structural risk assessment and published it in a PDF map,” said Griswold. “The fire staff wanted to update the assessment, add additional information, and move to an automated system, ensuring data is updated on a regular basis and providing more information for decision making. Moving to an online and open data system has the benefit of allowing residents to see what the city is looking at and considering, and better understand why we’re approaching certain projects the way we are.”
Finally, the city has also made data about traffic collisions available in a new table format. As part of its commitment to Vision Zero, the city developed an interactive collision map in 2017 that allows the public to see where all fatal and serious injury traffic collisions on Bellevue streets have taken place since 2007. There’s a bar chart tracking yearly totals and layers for collisions involving vehicles, bicycles or pedestrians. The collision data that powers the map is also now available.
These new resources come after Bellevue’s adoption of an open data policy in August 2017. Sunlight supported the City of Bellevue in writing and enacting it as part of What Works Cities.
“The additions to the open data portal reflect our continued commitment to transparency and civic engagement,” Sabra Schneider, Bellevue’s chief information officer, said in a statement. “We hope to empower members of the public, researchers, and entrepreneurs who want to use this data.”
These improvements helped Bellevue receive national attention for its commitment to digital government. In November, the city was recognized by the Center for Digital Government as a “Digital City,” in part because of the openness, engagement, and innovation that the data portal facilitates.
The city’s support for open data means this isn’t the last data set Bellevue plans to open, or even the finish line for these specific data sets.
“We’re planning to go back and ask Development Services how the online building permit data has helped their operations,” Griswold said. “In a few months, we’ll assess what has worked, what hasn’t and what we can do better in the future.”
If you have questions about the City of Bellevue’s open data work or ideas for how the city could do better, contact them at opendata@bellevuewa.gov. Be sure check out the city’s new building permits, fire risk, and traffic crashes data sets — and if you have ideas for how those datasets could help community organizations in the broader Bellevue community, email us at opencities@sunlightfoundation.com.