Using Data to Measure Open Data Policy Implementation
Does following open data policy guidelines lead to better implementation down the road?
With cities across the country drafting open data policies and prioritizing transparency as part of the What Works Cities Program, a major challenge is measuring the success of open data policy implementation. Thanks to analysis started by fellows from the Harris School of Public Policy at the University of Chicago, we’ve started to unpack the messy relationship between getting a policy on paper and carrying it out. Preliminary analysis suggests that cities whose open data policies follow Sunlight’s Open Data Guidelines tend to more successfully share open datasets.
Unfortunately, there is little existing quantitative research about open data policy and implementation in U.S. cities, partially because valid quantitative measures to evaluate open data at the city level are hard to find. By extracting data from the US City Open Data Census [1] and Sunlight’s Open Data Policy Comparison: Best Practices [2] spreadsheet, we built a dataset to analyze the policy and implementation of open data across American cities. While the Open Data Census is far from the perfect measure, it’s still the best and most comprehensive dataset we have available on open data implementation.
Gathering data from the Open Data Census and Sunlight’s guidelines
In the census, each city is given a score, from 0 to 1900, representing its overall open data performance. This score is the sum of performance scores for 19 specific datasets intended to represent subject areas with “high-value datasets.” Among the 56 cities we studied, the average overall score is 984, slightly more than half of the maximum possible score of 1900; the median is 840. Cities we studied fell into a wide range of overall scores:
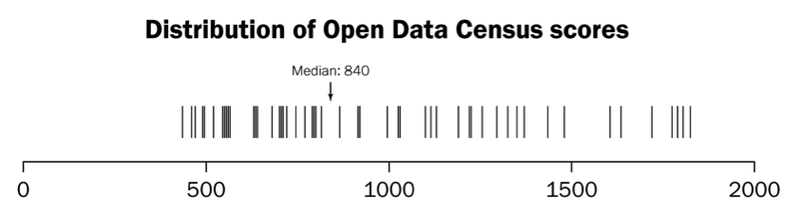
How cities scored on the US City Open Data Census. (Graphic credit: Sunlight Foundation)
Sunlight’s Guidelines suggest that cities focus on a few main priorities when crafting an open data policy: opening datasets, putting them online, providing them in bulk and machine-readable form, allowing open licensing, and updating data in a timely manner, among others. For each of the 56 cities we studied, we calculated the percentage of the 19 Census-specified datasets that meet these criteria.
Many cities are doing well at creating important data and posting it online, and most cities are able to keep the datasets up-to-date. For the average city, 89 percent of the datasets exist, with 83 percent of them being posted online, and an average of 74 percent of the datasets are considered timely. However, many cities have not prioritized sharing data in bulk and machine-readable form. The average city only provides 56 percent of the datasets in bulk form and 59 percent in machine-readable form. Additionally, our guidelines suggest that datasets should be freely used, reused and redistributed — in other words, have an open license. On average, cities only give 50 percent of their datasets open licenses.
Exploring the data: Preliminary findings
Of the 56 cities we studied from the Open Data Census, 31 of them (55 percent) have an open data policy. It is clear that having an open data policy highly correlates with better open data implementation. Cities with an open data policy score significantly higher on the Open Data Census than cities without open data policies. Sunlight’s Open Data Policies map records all open data policies in place, nationwide. There are many variables at play when determining how each of these cities succeed in implementing policy, so it’s very important to note that correlation between two factors does not imply causation, thus limiting the conclusions we can draw.
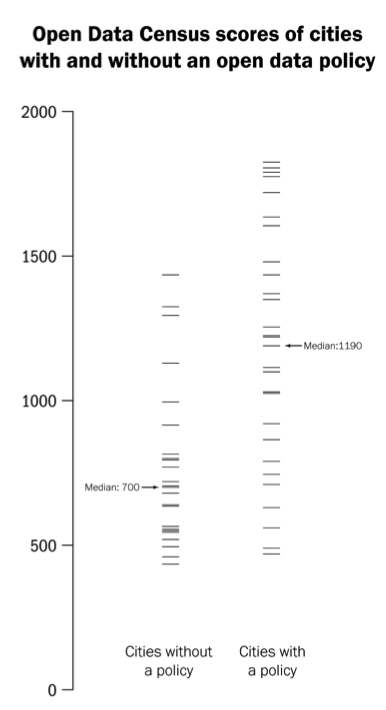
A comparison of how cities with and without an open data policy scored on the US City Open Data Census. (Graphic credit: Sunlight Foundation)
We also found that cities tend to score higher on the Open Data Census when:
- The open data policy is stronger according to our Guidelines
- The open data policy has been in place for longer
Our main finding is that a good score on the Open Data Census is positively correlated with the adoption rate of Sunlight’s Open Data Policy Guidelines, as measured by a policy’s “strength.” We measured this by looking at the policy’s adherence to a few of our strongest guidelines: to create a list of data holdings, create an oversight authority, create binding regulations for implementation, and setting a clear implementation timeline. We also factored in whether the policy was a legal ordinance, executive order, or resolution, which we consider to be the most sustainable means of implementation. Finally, we factored in whether the city has appointed something like an open data governance board or a chief data officer. We found that each of these components was highly connected to better policy implementation down the road, as measured by the Open Data Census.
A secondary finding showed that the longer a policy had been in place, the higher it scored on the Open Data Census. From what we know of working with cities, this reflects the real stories from champions in city government who fight for incremental progress over time.
Crafting a strong open data policy is at the center of Sunlight’s work with What Works cities. To learn more about the relationship between strong policy and successful open data policy implementation, dive into our other findings and the methodology for this analysis, or investigate the raw data.
Open data implementation that works
The What Works Cities Program is at the core of Sunlight’s local policy work. Our analysis above found that, compared to other cities of a similar size, cities participating in the program tend to perform better on the Open Data Census and adopt more of Sunlight’s Open Data Policy Guidelines. In addition to carrying out analysis on available data to track open data policy implementation, we record stories from local government voices on our blog. To read more about Sunlight’s work with cities on open data policy, see our local policy homepage.
While tools like the Open Data Census attempt to track open data implementation, we are still working to improve our understanding of what a well-implemented policy looks like. Some cities can start opening data based on our catalog of most commonly open datasets. Others may need to focus in on their city’s unique data needs. To explore the resources we provide to cities moving to track open data implementation, see our What Works Cities homepage.
Footnotes
[1] Retrieved June 24, 2016. Only cities with sufficient submissions on datasets are included. (To top) [2] Retrieved June 24, 2016. (To top)