The Political One Percent of the One Percent
This piece was prepared in collaboration with Ethan Phelps-Goodman.
If you think wealth is concentrated in the United States, just wait till you look at the data on campaign spending.
In the 2010 election cycle, 26,783 individuals (or slightly less than one in ten thousand Americans) each contributed more than $10,000 to federal political campaigns. Combined, these donors spent $774 million. That’s 24.3% of the total from individuals to politicians, parties, PACs, and independent expenditure groups. Together, they would fill only two-thirds of the 41,222 seats at Nationals Park the baseball field two miles from the U.S. Capitol. When it comes to politics, they are The One Percent of the One Percent.
A Sunlight Foundation examination of data from the Federal Election Commission and the Center for Responsive Politics reveals a growing dependence of candidates and political parties on the One Percent of the One Percent, resulting in a political system that could be disproportionately influenced by donors in a handful of wealthy enclaves. Our examination also shows that some of the heaviest hitters in the 2010 cycle were ideological givers, suggesting that the influence of the One Percent of the One Percent on federal elections may be one of the obstacles to compromise in Washington.
The One Percent of the One Percent are not average Americans. Overwhelmingly, they are corporate executives, investors, lobbyists, and lawyers. A good number appear to be highly ideological. They give to multiple candidates and to parties and independent issue groups. They tend to cluster in a limited number of metropolitan zip codes, especially in New York, Washington, Chicago, and Los Angeles.
In the 2010 election cycle, the average One Percent of One Percenter spent $28,913, more than the median individual income of $26,364
At the top of this elite group are individuals such as Bob Perry, CEO of Perry Homes, who gave $7.3 million to Karl Rove’s American Crossroads in 2010 and $4.4 million to Swift Vets and POWs for Truth in 2004, and Wayne Hughes, owner and chairman of Public Storage Inc., who gave $3.25 million to American Crossroads in 2010, and Fred Eshelman, CEO of Pharmaceutical Product Development who spent $3 million in 2010 on his own group, RightChange. Sunlight’s Ryan Sibley writes more about the top donors here.
Unlike the other 99.99% of Americans who do not make these contributions, these elite donors have unique access. In a world of increasingly expensive campaigns, The One Percent of the One Percent effectively play the role of political gatekeepers. Prospective candidates need to be able to tap into these networks if they want to be taken seriously. And party leaders on both sides are keenly aware that more than 80% of party committee money now comes from these elite donors.
Political scientists Wendy K. Tam Cho and James G. Gimpel have called these elite donor networks “campaign gold” after discovering just how much big contributors tend to flock together, making it easy for candidates to raise substantial sums of money at a single event.
We find that in the 2010 election cycle, 74 federally registered candidates relied on The One Percent of the One Percent for at least half of all of their itemized (over $200) contributions (of those running in that election, 25 won, and 15 lost – the other 34 were not up for election; mostly they were Senators preparing for a future campaign). Only in 2008 did more elected officials (109) rely on The One Percent of the One Percent for half of their itemized contributions. (Candidates and parties do not need to disclose to names of contributions under $200. In the 2010 election cycle, the average congressional campaign got 84% of its money from donations of $200 or more. See our methodology section for more details.)
Congressional candidates are also increasingly relying on contributions from people who do not live in their districts, according to research Professor Gimpel has conducted along with Frances Lee and Shanna Pearson-Merkowitz. In a paper entitled “The Check is in the Mail,” they find that candidates are increasingly calling on what the scholars call “political A.T.M.s” – the small number of zip codes that are home to the concentrated communities of high-spending donors.
In short, The One Percent of the One Percent are becoming more important to candidates. While technology may have expanded the possibilities of raising more money through small contributions over the Internet, The One Percent of the One Percent have remained just as important as ever. And with new campaign vehicles for unlimited funding, they are poised to play an even more important role.
What follows are more details about who The One Percent of the One Percent are, and their changing role in elections. (For more on how we define this population, please see our methodology section at the end.)
graphic by Ali Felski
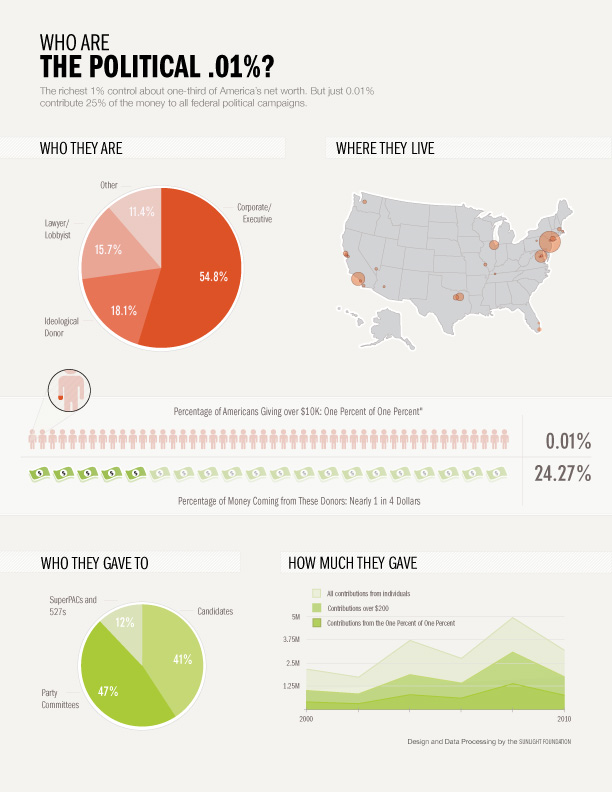
Who are The One Percent of the One Percent?
In examining the filings of The One Percent of the One Percent, three types of affiliations predominate: corporate, lawyer/lobbyist, and ideological. The three types of affiliations have also been remarkably consistent over time. Roughly 55% of these elite donors have been affiliated with companies, roughly 16% have been affiliated with law and lobbying firms, and roughly 18 % we classify as ideological. The remainder either does not list enough information for us to make a determination or do not fit into one of the three dominant categories. (For more details on how we sorted the donors into categories, please see our methodology section at the end)
Table 1. Share of The One Percent of the One Percent belonging to each category
| Cycle | Corporate | Lawyer/Lobbist | Ideological |
|---|---|---|---|
| 1990 | 56.5% | 14% | 15.1% |
| 1992 | 57.8% | 14% | 15.5% |
| 1994 | 54.2% | 15.7% | 18.2% |
| 1996 | 54.6% | 15.6% | 17.8% |
| 1998 | 54.6% | 16.4% | 17.8% |
| 2000 | 54.3% | 15.8% | 18.7% |
| 2002 | 53.6% | 15.8% | 18.8% |
| 2004 | 54.7% | 15.8% | 18.3% |
| 2006 | 54.6% | 15.5% | 19.3% |
| 2008 | 54.5% | 15.8% | 18.5% |
| 2010 | 54.8% | 15.7% | 18.1% |
The Corporate One Percent of One Percent
Corporate affiliations are the most common. To the extent that donors listed occupations (many do not), the most common titles were variations on “President,” “CEO,” “Executive,” Chairman”, and “Investor.”
Of the 10 companies with the most representation in The One Percent of the One Percent in the 2010 election cycle six are financial companies. Goldman Sachs, with 92, far outpaces everyone else. Citigroup, with 32, is second.
Table 2. Companies listed most commonly by The One Percent of the One Percent, 2010 election cycle
| Corporation | # of The One Percent of One Percent |
|---|---|
| Goldman Sachs | 92 |
| Citigroup | 32 |
| Microsoft | 29 |
| Federated Investors | 14 |
| RJ Reynolds Tobacco | 13 |
| Comcast | 12 |
| E&J Gallo Winery | 12 |
| MBNA Corp | 12 |
| American International Group | 11 |
| Bear Stearns | 11 |
A total of 94 companies had five or more members of The One Percent of the One Percent.
The Lawyer/Lobbyist One Percent of One Percent
A second category of The One Percent of the One Percent comprises individuals affiliated with lobbying and law firms. Lobbyists are well known to be important as campaign fundraisers; they are also frequently quite large contributors themselves. Typically they make up between 15 and 20% of The One Percent of the One Percent.
Table 3. Lobbying firms listed most commonly by The One Percent of the One Percent, 2010 election cycle
| Organization | # of The One Percent of One Percent |
|---|---|
| Akin, Gump et al | 22 |
| Williams & Jensen | 20 |
| Patton Boggs LLP | 20 |
| PMA Group | 17 |
| Skadden, Arps et al. | 15 |
| Cassidy & Associates | 13 |
| Sullivan & Cromwell | 13 |
| Kirkland & Ellis | 12 |
| Simmons Cooper LLC | 9 |
| Verner Liipfert | 9 |
| Hogan & Hartson | 8 |
A total of 49 law and lobbying firms had five or more members of The One Percent of the One Percent.
The Ideological One Percent of One Percent
In the 2010 election cycle, 18.1% of The One Percent of the One Percent we identified as ideological based on their giving patterns and affiliations. Of these donors, a handful of groups dominate – EMILY’s List (162), Club For Growth (70), and Act Blue (70).
Table 4. Ideological groups listed most commonly by The One Percent of the One Percent, 2010 election cycle
| Organization | # of The One Percent of One Percent |
|---|---|
| EMILY’s List | 162 |
| Club for Growth | 70 |
| ActBlue | 70 |
| Moveon.org | 14 |
| Democratic Congressional Campaign Committee | 10 |
| Act Blue / EMILY’s List | 7 |
| EMILY’s List / Moveon.org | 6 |
| League of Conservation Voters | 6 |
| Senate Conservatives Fund | 6 |
| JStreetPAC | 5 |
Comparing the three types
Looking at the three different types of donors side by side for the 2010 election cycle, a few patterns emerge.
The ideological contributors on average spend the most (their median contribution level is $17,976). They also give the most money to independent expenditure groups (like American Crossroads) – 21.8%, much more than the other two types of donors. They give on average to 9.5 different candidates.
The lawyer/lobbyist donors give the most money directly to candidates (51.1% goes directly to candidates), and they give to the most different candidates (10.1 on average). Presumably, this is because they are interested in maintaining access to multiple elected officials.
The corporate contributors are the only category to give primarily to Republicans (they contribute 44.1% to Republican candidates and party committees, as compared to 39.8% to Democratic candidates and party committees; the rest goes to other vehicles, including independent expenditures). They tend to give to half as many candidates as they (on average less than 4.6) and give almost half of their money to party committees (the highest percentage of the three types).
Table 5. Patterns of giving by Super Donor type, 2010 election cycle
| Law/Lobbying | Ideological | Corporate | All | |
|---|---|---|---|---|
| Median total given | $16,350 | $17,976 | $15,000 | $15,200 |
| Mean total given | $28,797 | $37,933 | $27,719 | $28,913 |
| Mean # of candidates given to | 10.1 | 9.5 | 4.6 | 6.4 |
| % of money to candidates | 51.1% | 43.4% | 35.4% | 39.5% |
| % given to party committees | 42.0% | 35.8% | 48.5% | 45.7% |
| % given to independent expenditure groups | 7.3% | 21.8% | 9.4% | 11.6% |
| % Given to Democratic candidates and parties | 70.6% | 44.6% | 39.8% | 46.6% |
| % Given to Republican candidates and parties | 22.6% | 34.6% | 44.1% | 38.5% |
Classes of The One Percent of the One Percent
Even within the elite universe of The One Percent of the One Percent, some contributors are more high-powered than others. An elite cadre of 15 contributors each gave more than $500,000, and an almost-as-elite group of 252 gave between $100,001 and $500,000. These high-spending donors give their money primarily through independent expenditure groups, and tend to be more ideological.
The next two classes of The One Percent of the One Percent (those giving between $50,001 and $1000,000 and those giving between $25,001 and $50,000) tend to favor parties as their contribution vehicles of choice. More than half of The One Percent of the One Percent gave less than $25,000. These split more equally between candidates and parties.
Table 6. The One Percent of the One Percent by giving bracket, 2010 election cycle
| More than $500K | $100,001-$500,000 | $50,001-$100,000 | $25,001-$50,000 | $10,000-$25,000 | |
|---|---|---|---|---|---|
| # of The One Percent of One Percent | 17 | 995 | 2,468 | 4,907 | 18,305 |
| Amount Given | $27,761,319 | $135,925,304 | $172,008,627 | $169,265,649 | $266,124,661 |
| % of Political 0.0% money | 3.6% | 17.6% | 22.2% | 21.9% | 34.4% |
| % who are corporate | 47.1% | 47.7% | 55.2% | 54.4% | 58.7% |
| % who are lawyer/lobbyists | 0.0% | 15.7% | 17.2% | 18.7% | 14.8% |
| % who are ideological | 52.9% | 33.4% | 22.8% | 19.0% | 14.6% |
| % given to independent expenditure groups | 92.4% | 13.4% | 7.4% | 7.2% | 7.7% |
| % given to candidates | 2.7% | 30.4% | 34.4% | 42.3% | 49.6% |
| % given to parties | 4.9% | 58.1% | 59.5% | 49.8% | 31.9% |
The Rise of The One Percent of the One Percent
In the last two decades, both the cost of campaigning and the size of campaign donor bases have increased. So has the number of individuals giving $10,000 or more in real 2010 dollars, the cut-off point to be included in The One Percent of the One Percent. (For purposes of comparability, we’ve kept the cut-off point stable over time. See our methodology section for more details)
A few trends are worth highlighting. The community of donors giving more than $10,000 (in 2010 dollars) has more than quadrupled, from 6,456 in 1990 to 26,783 in 2010. In 1990, they accounted for 28.1% of all itemized (over $200) donations. By 2010, that number had risen to 44.1%. These donors are also accounting for an increasing number of all donations. And they’re giving more, too. In 1990, the average donation was $13,443. By 2010, it was more than double: $28,913.
Table 7. Evolution of The One Percent of the One Percent
| Cycle | Membership of The One Percent of One Percent | Median amount given | Average amount given | Share of itemized donors | Share of all itemized contributions | Share of all contributions |
|---|---|---|---|---|---|---|
| 1990 | 6456 | $10,000 | $13,443 | 2.0% | 28.1% | N/A |
| 1992 | 10486 | $11,000 | $16,317 | 2.1% | 31.9% | N/A |
| 1994 | 8167 | $11,000 | $16,926 | 1.7% | 28.2% | N/A |
| 1996 | 16255 | $14,056 | $25,627 | 2.4% | 41.6% | N/A |
| 1998 | 11305 | $12,500 | $22,507 | 2.2% | 36.8% | N/A |
| 2000 | 19927 | $13,590 | $25,868 | 2.4% | 40.3% | 19.0% |
| 2002 | 14406 | $13,500 | $27,377 | 1.9% | 38.2% | 18.7% |
| 2004 | 32616 | $15,355 | $27,680 | 2.9% | 41.9% | 21.2% |
| 2006 | 25469 | $15,550 | $25,495 | 3.2% | 41.9% | 22.1% |
| 2008 | 44743 | $17,400 | $30,790 | 3.4% | 44.3% | 27.5% |
| 2010 | 26783 | $16,850 | $28,913 | 3.3% | 44.1% | 24.3% |
Parties are becoming more reliant on The One Percent of the One Percent
Individuals can give up to $30,800 per year to party committees, making these elite donors especially valuable to Democratic and Republican officials. In 2010, party committees relied on The One Percent of the One Percent for 81.6% of all itemized contributions, the second-highest percentage since 1990, which is as far back as our data go.
As party committees raise more money, they are becoming more reliant on big donors. The last four cycles election mark four of the five cycles in which the parties have been most reliant on donors giving more than $10,000.
Table 8. Parties’ reliance on The One Percent of the One Percent
| Cycle | Total parties raised from itemized contribution | % of itemized contributions from One Percent of One Percent | Republican Party % of itemized contributions from One Percent of One Percent | Democratic Party % of itemized contributions from One Percent of One Percent |
|---|---|---|---|---|
| 1990 | $111,769,441 | 59.7% | 53.7% | 67.8% |
| 1992 | $175,162,189 | 64.0% | 57.0% | 73.6% |
| 1994 | $139,056,980 | 70.8% | 60.6% | 84.0% |
| 1996 | $484,053,381 | 44.9% | 38.8% | 53.1% |
| 1998 | $261,258,960 | 55.0% | 48.2% | 64.3% |
| 2000 | $528,119,721 | 46.4% | 43.7% | 49.4% |
| 2002 | $426,944,679 | 41.1% | 37.6% | 45.6% |
| 2004 | $763,117,406 | 67.8% | 63.8% | 72.5% |
| 2006 | $596,278,361 | 92.7% | 91.6% | 93.9% |
| 2008 | $1,202,227,211 | 66.4% | 60.2% | 73.0% |
| 2010 | $522,058,279 | 81.6% | 85.9% | 77.9% |
Politicians are more becoming reliant on The One Percent of the One Percent
Candidates are also becoming increasingly reliant on The One Percent of the One Percent as sources of funding.
In 1990, only 13 federal candidates relied on The One Percent of the One Percent for at least half of their itemized donors. In the 2010 election cycle, 74 did. A big transition happened in the wake of the McCain-Feingold campaign finance regulations in 2002. With soft money off the table, individual campaigns became much more reliant on big The One Percent of the One Percent. In 2004, 56 candidates relied on The One Percent of the One Percent for at least half of their campaign funding, as compared to just nine the year before.
Table 9. Candidates relying on The One Percent of the One Percent for at least half of their itemized contributions
| Total | Republicans | Democrats | |
|---|---|---|---|
| 1990 | 13 | 5 | 8 |
| 1992 | 17 | 3 | 14 |
| 1994 | 10 | 5 | 5 |
| 1996 | 6 | 0 | 6 |
| 1998 | 12 | 5 | 7 |
| 2000 | 17 | 8 | 8 |
| 2002 | 9 | 3 | 6 |
| 2004 | 56 | 23 | 31 |
| 2006 | 53 | 25 | 26 |
| 2008 | 109 | 34 | 74 |
| 2010 | 74 | 22 | 50 |
Over time, the share of all individual campaign contributions coming from The One Percent of the One Percent has increased for both parties, increasing from 17.8% in 1990 to 32.1% in the 2010 election cycle. Consistently, Democrats have been slightly more reliant on The One Percent of the One Percent than Republicans – relying on The One Percent of the One Percent for, on average, about three percentage points more of their itemized campaign receipts.
Table 10. Share of itemized candidate money coming from The One Percent of the One Percent
| All Candidates | Republicans Candidates | Democratic Candidates | |
|---|---|---|---|
| 1990 | 17.8% | 14.5% | 20.9% |
| 1992 | 19.4% | 16.6% | 21.7% |
| 1994 | 17.0% | 13.3% | 20.9% |
| 1996 | 14.7% | 13.3% | 16.6% |
| 1998 | 17.8% | 15.3% | 20.6% |
| 2000 | 21.2% | 19.3% | 23.8% |
| 2002 | 19.0% | 17.4% | 20.6% |
| 2004 | 32.6% | 31.0% | 34.5% |
| 2006 | 30.4% | 28.3% | 31.6% |
| 2008 | 33.2% | 32.0% | 34.1% |
| 2010 | 32.1% | 29.7% | 35.0% |
Looking at the top recipients of One Percent of the One Percent money among current House and members (measured by share of their itemized* donations coming from The One Percent of the One Percent), Californians and Democrats dominate. Six of the ten House Members relying most on The One Percent of the One Percent are from California. Seven of the ten House Members are Democrats.
*We count only itemized (over $200) donations here, since the names of donors are not provided for contributions under $200. Contributions of $200 and up typically account for 80% of all campaign donations.
Table 11. Current House members most dependent on One Percent of One Percent money in the 2010 election cycle
| Member | Share of all itemized funding from The One Percent of One Percent | Total money raised from The One Percent of One Percent |
|---|---|---|
| Pete Stark (D-CA) | 80.6% | $25,000 |
| Nancy Pelosi (D-CA) | 74.5% | $713,585 |
| Debbie Wasserman Schultz (D-FL) | 59.0% | $444,592 |
| Jerry Lewis (R-CA) | 57.3% | $103,600 |
| George Miller (D-CA) | 56.5% | $200,085 |
| Gregory Meeks (D-NY) | 56.3% | $148,705 |
| Mario Diaz-Balart (R-FL) | 55.8% | $172,838 |
| Doris Matsui (D-CA) | 55.3% | $125,390 |
| Anna Eshoo (D-CA) | 55.3% | $351,123 |
| John Kline (R-MN) | 53.7% | $359,510 |
Senators most dependent on The One Percent of the One Percent also are more likely to be Democrats. For the 2010 election cycle, seven of the top ten candidates most reliant on The One Percent of the One Percent were Democrats. Interestingly, the top nine candidates most reliant on The One Percent of the One Percent in their fundraising were not actually up for election. Among the top ten, only Kelly Ayotte (R-NH) was actually on the ballot last year. The other two Republicans who rely most heavily on The One Percent of the One Percent are in two of least populous states.
Table 12. Current senators most dependent on One Percent of One Percent money in the 2010 election cycle
| Senator | Share of all itemized funding from The One Percent of One Percent | Total money raised from The One Percent of One Percent |
|---|---|---|
| John Kerry (D-MA) | 61.8% | $1,109,100 |
| James Risch (R-ID) | 61.5% | $30,950 |
| Mark Pryor (D-AR) | 60.8% | $49,900 |
| Kay Hagan (D-NC) | 60.1% | $123,662 |
| Ben Nelson (D-NE) | 58.9% | $356,126 |
| Mark Udall (D-CO) | 57.5% | $187,449 |
| Byron Dorgan (D-ND) | 57.1% | $625,424 |
| Jeanne Shaheen (D-NH) | 56.3% | $135,850 |
| Mike Enzi (R-WY) | 55.9% | $13,400 |
| Kelly Ayotte (R-NH)* | 55.6% | $2,005,614 |
* Actually up for election the 2010 election cycle
Another important aspect of The One Percent of the One Percent’s money is that the majority of it comes from out of state. While in general, candidates have relied on out-of-state money for about one in three of all their itemized dollars, this share is much higher when it comes to itemized donations from The One Percent of the One Percent. The share of The One Percent of the One Percent money coming from out of state has hovered around 55%. This reflects the fact that The One Percent of the One Percent are not spread evenly across the country.
Table 13. Share of One Percent of One Percent money from out of state
| Cycle | One Percent of One Percent Share from Out of State | Itemized Share from Out of State |
|---|---|---|
| 1990 | 65.1% | 33.5% |
| 1992 | 52.8% | 29.5% |
| 1994 | 55.5% | 29.7% |
| 1996 | 56.4% | 30.1% |
| 1998 | 55.3% | 28.5% |
| 2000 | 54.4% | 34.1% |
| 2002 | 61.2% | 33.0% |
| 2004 | 53.3% | 35.6% |
| 2006 | 58.3% | 36.9% |
| 2008 | 54.8% | 43.7% |
| 2010 | 53.4% | 34.9% |
The Geography of The One Percent of the One Percent
graphic by Drew Vogel
Members of the One Percent of the One Percent are not evenly distributed throughout the country, as the accompanying map makes clear (though over time, clusters of One Percent of the One Percent money are showing up in more and more parts of the country).
They overwhelmingly congregate in a handful of metro areas. In the 2010 election cycle, the top metro area for The One Percent of the One Percent were New York, NY (2,981), Washington, DC (2,095), Los Angeles, CA (1,358), Chicago, IL (1,244) and San Francisco, CA (1,047). The list of top One Percent of the One Percent metro areas is almost exactly the same as it was in 1990. The only new city is hedge-fund rich Greenwich, CT, which displaced Houston to #11 on the list.
Table 14. Top Metro areas for The One Percent of the One Percent, 2010 election cycle
| Area | # of The One Percent of One Percent |
|---|---|
| New York City, NY | 2,981 |
| Washington, DC | 2,095 |
| Los Angeles, CA | 1,358 |
| Chicago, IL | 1,244 |
| San Francisco, CA | 1,047 |
| Boston, MA | 877 |
| Miami, FL | 862 |
| Philadelphia, PA | 646 |
| Dallas, TX | 607 |
| Greenwich, CT | 536 |
Table 15. Top Metro areas for The One Percent of the One Percent, 1990 election cycle
| Area | # of The One Percent of One Percent |
|---|---|
| New York City, NY | 835 |
| Washington, DC | 498 |
| Los Angeles, CA | 465 |
| Chicago, IL | 219 |
| Miami, FL | 166 |
| San Francisco, CA | 161 |
| Dallas, TX | 151 |
| Philadelphia, PA | 123 |
| Houston, TX | 122 |
| Boston, MA | 121 |
But even within these metro areas, a small number of zip codes stand out.
In New York, the top zip codes are 10021 (Upper East Side), 10024 (Upper West Side), 10023 (Upper West Side), 10028 (Upper East Side), 10019 (Upper West Side)
Table 16. Top New York zip codes
| Zip code | # of The One Percent of One Percent |
|---|---|
| 10021 | 109 |
| 10024 | 105 |
| 10023 | 67 |
| 10028 | 67 |
| 10019 | 61 |
In Washington, DC, the top zip codes are 20007 (Georgetown) and 20008 (Cleveland Park), 22101 (McLean, VA), 20815 (Chevy Chase) and 20817 (Bethesda)
Table 17. Top Washington, DC zip codes
| Zip code | # of The One Percent of One Percent |
|---|---|
| 20007 | 60 |
| 20008 | 57 |
| 22101 | 57 |
| 20815 | 50 |
| 20817 | 43 |
In Los Angeles, CA, the top zip codes are 90210 (Beverly Hills), 90067 (Century City), 90077 (Bel Air), and 90025 (West L.A.), 90402 (Santa Monica)
Table 18. Top Los Angeles, CA zip codes
| Zip code | # of The One Percent of One Percent |
|---|---|
| 90210 | 75 |
| 90067 | 44 |
| 90077 | 34 |
| 90025 | 29 |
| 90402 | 29 |
These geographical patterns highlight that these The One Percent of the One Percent concentrate together in high-income areas. They are far from evenly distributed throughout the nation.
Conclusions
There are approximately 312 million people living in the United States. Yet just 26,783 (less than one in ten thousand) accounted for 24.3% of all political contributions in the 2010 election cycle.
Unlike the 99.99% of Americans who do not spend ten grand of their own money on an election cycle (mostly because they can’t afford to do so), The One Percent of the One Percent have unique access to candidates and party leaders. They know that candidates and parties need their money, and this presumably allows them to play a kind of gatekeeper role, allowing them to set the parameters of priorities of “legitimate” politics.
They congregate in a limited number of elite zip codes. Their concerns are not the concerns of ordinary Americans.
Some are motivated by ideological reasons. For others, the motivation is less partisan and more pragmatic: Many are lawyers and lobbyists, and even more are corporate executives, all seeking to influence legislation and policy.
Over time, more individuals are choosing to spend $10,000 or more on politics, and candidates and especially parties are becoming more reliant on them. With new vehicles for unlimited money in the 2012 election, a small number of individuals with both the means and the motive to spend lavishly on elections are poised to play an even greater role. To the extent that the priorities and interests of these elite donors are not representative of the country, there are good reasons to be concerned that their unique access is having a distorting impact on our politics.
Methodology
All of the data used in this analysis originates from the Federal Election Commission. Information on the total amounts raised by candidates and committees comes from the FEC’s summary files, available here. Information on itemized contributions (contributions over $200) is published by the FEC and standardized by our partner organization, The Center for Responsive Politics. (CRP). CRP identifies unique donors and assigns organizational and ideological affiliations. Contributions under $200 are not required to be itemized, so our analysis cannot say anything about the characteristics of this group of donors, other than the total amount of money raised.
Figures for total amounts given by all individuals are computed by summing the total individual amounts listed in the candidate and PAC summary files. Contributions coming from organizations, rather than individuals, are not considered anywhere in our analysis. Figures for the total itemized contributions are taken by summing all contributions from individuals in the CRP itemized data. The only exception is candidate self-contributions (FEC transaction type `15c`), which are excluded from the analysis. This results in figures that are higher than those reported by CRP here since CRP’s analysis includes only contributions to candidate, party and leadership committees, and not independent committees.
We identified the set of super donors by finding all CRP contributor IDs associated with at least $10K in contributions in a single cycle. These contributions could be to candidates, party committees, or independent groups. Because of contribution limits to candidates and party committees, donors in the upper ranges of the super donors are giving mostly to 527s and SuperPACS, for which there are no contribution limits.
We categorized the donors using CRP’s `ContribCode` field, which includes codings for lobbyists, ideological groups and business sectors. If the candidate has given any money to an ideological group then they are considered an ideological donor. If they have given any money as a lobbyist then they are considered a lobbyist donor. If the contributions fall into any of the hundreds of business sector categories then they are considered a corporate donor.