Measuring Lobbyists with Raspberry Pi
 A few of us in the labs dabble in hardware hacking, and we were all pretty excited by the debut of the Raspberry Pi. So when we saw that MAKE Magazine was running a contest for creative uses of the Pi, we figured we’d better enter.
As it happens, I had picked up a handsome vintage voltmeter at Uncommon Objects during a recent trip to Austin, and had been toying with the idea of making it Pi-enabled. With this competition for inspiration I decided to take the plunge.
For projects like this, I find that getting wifi working on Linux is almost always the biggest hurdle (it took me months and months on the Beaglebone). Fortunately, Lady Ada has helpfully identified a cheap, Pi-friendly wifi adapter. I had some minor headaches related to the limited USB current capacity of the Raspberry Pi revision 1 board, and then some bigger ones as I figured out that wicd-curses will blow up your SSH connection as you try to set up wifi connectivity. But with a rev 2 board in hand and securely connected to HDMI and a USB keyboard, I was able to configure the Pi and get it online.
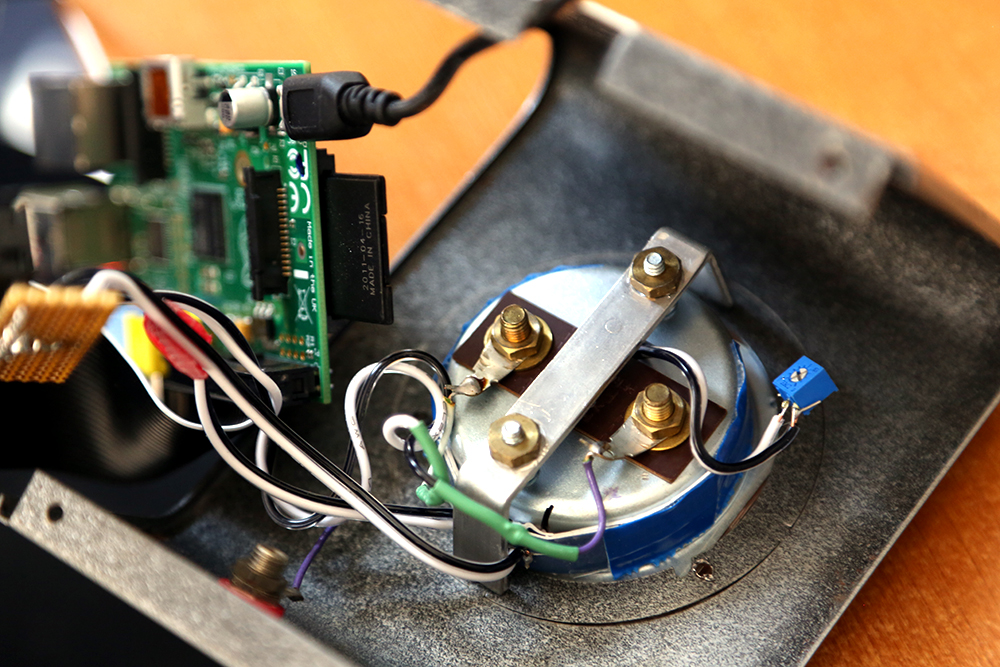
The build was pretty simple: the only real challenge was getting the Raspberry Pi’s built-in pulse width modulation (PWM) capability to play nicely with the meter. For those who aren’t familiar with microcontrollers, the idea behind PWM is pretty simple: it’s just a fast pulse of on and off voltages. You can use this for a bunch of different things, but for this application the idea is just to create a signal that’s on for some percentage of the time and off for the rest of the time, with such a fast cycle that it looks like a solid but variable voltage to analog devices like the meter.
The Pi can generate PWM signals that go from 0 to 100% duty cycle, with 100% being 3.3V — the WiringPi library makes this really easy, in fact (as long as you’re willing to run your script as root). The meter was designed for a 0 to 15V range (I stupidly misremembered this as 5V in the video below). That range is defined by a resistor in the meter. If you wire another resistor in parallel, the system’s range can be changed. I used a trim pot so that I could adjust the position of the needle until it looked right with the Pi PWM running at 100%.
The meter is a relatively old piece of hardware, and I knew its accuracy might not be perfect. In particular, I couldn’t count on voltage and needle position to map to one another linearly. In other words, if the needle could move through a 90 degree range of motion, it would be a mistake to assume that a 50% voltage would leave the needle pointing at the 45 degree position. So I wrote some calibration code that slowly swings the needle through its full range. The user hits a key when the needle passes the markers on the meter’s gauge. By remembering what the PWM setting was at the time of each keypress, a calibration file can be generated. In the future, you can just decide which number on the gauge you want to display, and the support library does some simple arithmetic to interpolate between recorded calibration points, putting the needle just where it ought to be.
So I had flexible meter. What did I want to measure? Well, a big part of Sunlight’s mission is measuring political influence, of course, and this seemed like a nice way to highlight the capabilities and limits of the data that government provides. So, with help from Jacob, I adapted one of the techniques used by his Lobbyist Registration Tracker. Every few minutes a Python script running on the Pi fills out a form on the Senate Office of Public Records website, and counts how many new registrations have shown up this week. Unfortunately, the SOPR site only seems to post new registrations once per day (though there are some strange exceptions to the usual schedule — we’re still waiting to hear back from them about why this is). Still, over the course of a week the numbers add up and the delays become less important. We sure would prefer real-time disclosure, though…
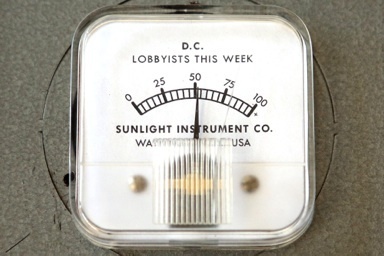
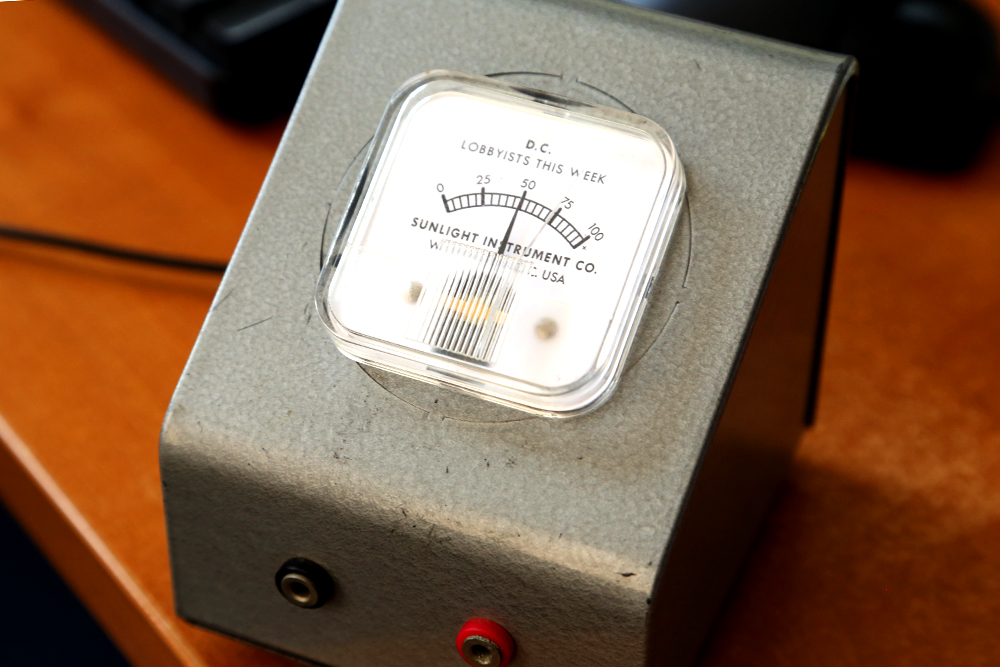
At any rate, the needle slowly ticks up from zero starting on Sunday morning. If it hits 90, an amber LED that I added to the meter turns on. And if the meter maxes out at 100, it turns red. With the software working, all that was left was to change the labeling on the meter to reflect its new capabilities. I scanned the original label, and in seemingly no time Amy had vectorized and modified it into the lovely variation you can see below:
I think that’s about it! I don’t know if we have much of a chance in MAKE’s contest (I suspect that there are going to be much more sophisticated entries), but this was a fun project and a nice way to connect hobbyist electronics to our mission a bit more directly than some of our earlier efforts. If you’re considering a similar project, I posted a few more notes here.
Thanks to MAKE for the nudge; to Gordon Henderson for WiringPi; to Limor Fried for her awesome Pi-centric documentation; to Jacob and Amy and Tim and Solay for their help debugging, building and filming; and of course to the folks who created the Pi in the first place!


