Where local governments are paying the bills with police fines

The dependence of thousands of American cities and town on judicial fines and forfeiture to fund public services is unhealthy for democracy. Public awareness of the depth of the problem has been growing since the Department of Justice’s 2014 investigation into the Ferguson, Mo., police, following the shooting of Michael Brown.
According to a Sunlight examination of 2013 Census data, Louisiana, Arkansas, Georgia, Illinois and Mississippi topped the list of states where city governments relied heavily on fines and forfeits for funding. We concluded this by examining the ratio of local fines and forfeits to local tax in order to see where local governments rely particularly heavily on fines and forfeits to pay for basic services. Using this metric, the government of Henderson, Louisiana relied most on these types of fines and forfeits. Henderson collected $3.73 in fines and forfeits for every $1 it collected in taxes. Out of the five municipal governments which reported collecting more money from fines than from taxes in 2013, three (Henderson, Pollack, and Olla) were from Louisiana. All five were towns with populations under 1,500. This suggests that most of those fines were probably paid by people who did not live in those towns, but who nonetheless had to drive through them.
The Louisiana towns were unusual relative to the rest of the local governments sampled by the Census. The median ratio of fines and forfeit revenue to tax revenue for city and county governments was 0.02 – that is, the median city or county collected two cents in fines and forfeits for every dollar it collected in taxes. Averaging local governments by state revealed that high relative collection of fines and forfeits is more common in some states than others. The following table displays the ten states with local governments demonstrating the highest fines-to-tax ratio.
How to use tax and Census data to reveal the story
How did we figure this out? Knowing how much a given city depends on criminal and civil fines is difficult because it’s hard to get detailed information. In our collaboration with MuckRock last November, we received no information from our public records requests for detailed data on the kind and amount of fines levied by a sample of cities. Frankly, it’s challenging to even get aggregate information on fines issued by local law enforcement and local courts.
Meanwhile, even when individual departments do provide information, it can be hard to know whether it represents high, low, or average collection of fines and forfeits. There are so many local governments, and so few places where their data is aggregated, that it’s hard to find a significant collection of useful data in order to make comparative observations about any one place.
Nonetheless, local government data is aggregated under certain programs. In recent posts, we examined the local government data that has been aggregated through the Uniform Criminal Reporting (UCR) program. To learn more about local fines, though, we need different data sources.
While far from complete, there are a couple of meaningful, publicly-accessible collection points for local government finance data. We can begin by looking at two major sources of financial data for local governments: the annual US Census survey of state and local government finance and the Electronic Municipal Market Access (EMMA) database of the Municipal Securities Rule Board (MSRB).
The most recent US Census data on local government finance is for 2013. The survey collects information on “revenue, expenditure, debt, and assets (cash and security holdings)” for all states and a representative sample of local governments. To see information at the level of individual local governments, you must download, unzip and format the public-use individual unit file. Each line of data contains an ID number for each place, a code for each category of revenue and expenditure, and an amount of money collected or expended.
Code U30 identifies the total amount of “revenue from penalties imposed for violations of law; civil penalties (e.g., for violating court orders); court fees if levied upon conviction of a crime or violation; court-ordered restitutions to crime victims where government actually collects the monies; and forfeits of deposits held for performance guarantees or against loss or damage (such as forfeited bail and collateral).” The category does not include penalties for late tax payment, library fines, or sale of confiscated property.
Since individual lines may be inaccurate, it is best to use the database for looking at trends and averages.
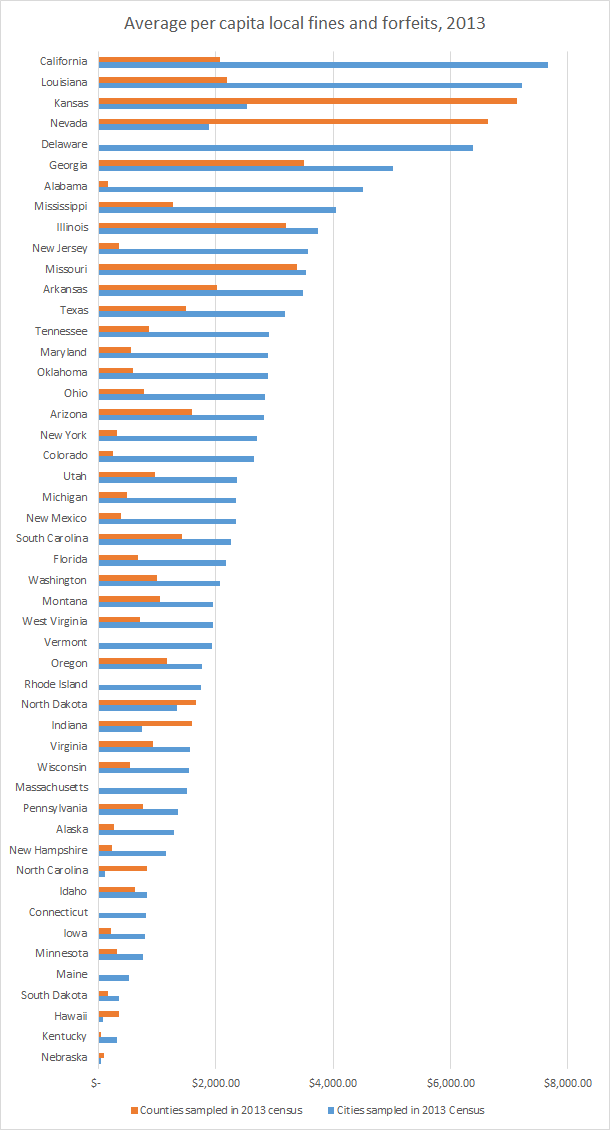
First, we can use information about local population together with the fines and forfeits total in order to see where fines and forfeits are likely to play a particularly significant financial role. We can note, for example, that there is significant state-level variation in the average amount of fines and forfeits that local governments collect, per capita. The states where local governments assess, on average, the most fines and forfeits per capita do so at a rate that’s four times higher than the states doing it the least. Cities typically collect more fines and forfeits per capita than counties do — although the opposite is true in a handful of states, most notably Kansas and Nevada.
It would be useful to be able to be able to compare local governments on the proportion of their total revenue that comes from fines and forfeits, but the Census data was insufficiently exhaustive to provide this measure consistently. Instead, we can look at how a local government’s collection of fines and forfeits compares to its collection of taxes. The Census provides data on all of the varieties of tax that local governments collect, from the very common property and sales tax to more obscure ones, like taxes on airports. Our extract of Census data containing the 2013 information on tax and fine revenue from all sampled city or county governments that reported revenue from both taxes and fines is available for download here.
With the substantial amount of information it collects together, the U.S. Census provides an unparalleled data source for understanding the broader picture for local government finances. To get into the specifics of any one location, however, we need primary sources. Happily, the “fines and forfeits” category is not just a Census category. It is also a common category for local government budgets, typically available on all local government websites.
Disclosure of revenue collection through fines and forfeits can also be found in the Comprehensive Annual Financial Reports (CAFR) that local governments provide as an aspect of their financial disclosures for the issuance of municipal bonds, which means that this information can also be found on the MSRB’s EMMA database. Find individual local governments by choosing a state, then a bond-issuing local government, and then select “Financial Disclosures” to find that government’s CAFR history. While we can only look at CAFRs individually, the EMMA repository is a useful tool for supporting comparisons of governments regionally, or over time.
Neither the Census nor the MSRB offers an unproblematic answer to the question of where to get information about these issues. The survey of state and local finances is sometimes inaccurate, a possibility the Census acknowledges in a disclaimer.
For example, the 2013 US Census survey shows Boulder, Colo., reporting zero revenue from fines and forfeits, when the city’s budget documentation shows otherwise. The MSRB provides PDFs of individual government budget documents, but no machine readable data. Nonetheless, both data sources provide critical and comparable information about governmental dependence on fines and forfeits.
Cash cow police departments are abnormal
What existing data tells us is that it is not normal for governments to raise significant revenue through their policing activities. Across Florida, for example, fines and forfeitures represented an average of 1% of cities’ revenue between 1995 and 2009. In economically healthy cities, although the absolute dollar total of city-issued fines and forfeitures can be large, it still represents a small proportion of city revenue. Washington, D.C. currently raises about 1.7% of its total revenue through fines and forfeitures (and it appears that over 70% of the fines and forfeitures total comes from speed cameras, which produced $85 million in city revenue during FY 2015.) San Francisco and New York City both raise about 1.1% of their total revenues through fines and forfeitures.
There is also evidence, however, that this changes when cities come under financial pressure, and that local governments collect more fines when other forms of city revenue decline. One study, examining North Carolina’s response to the early-2000s recession, showed that increased ticketing by local police made up 38% of the annual decline in city revenue.
This was a more frequent situation for local governments after the 2007 recession produced a serious decline in municipal property tax revenue. Cities have expanded their use of some kinds of revenue-generating law enforcement practices, like red-light cameras and speed cameras [cite].
Individual cases show how economic pressure leads to an interest in finding ways that police can generate additional municipal revenue. Between 2007 and 2013, failing local revenue forced the police department of West Covina, Calif., to cut 37% of its staff. The city’s 2014 budget noted that as a result, “understaffing is both a public safety and customer service issue, as residents have to wait longer for responses to non-emergency calls, and supervisory span of control has been reduced.” The California-based Drug Policy Alliance studied revenues for West Covina, among other California towns, and found a strong relationship between local budget pressure and increased police collection of civil forfeiture money:
In West Covina forfeiture income surged in the wake of budget cuts to the police department. After growing for several consecutive years, general fund appropriations for West Covina’s police budget were cut by over $1 million in FY 2011. The following year, the department’s forfeiture take more than quadrupled. In fiscal years 2011, 2012 and 2013, the police budget was cut a combined $1,677,134. In that same period, the department received $5,529,409 from DOJ equitable sharing, more than making up for the budget cuts. The amount of DOJ forfeiture revenue police collected in those 3 years as budget appropriations were shrinking was more than 7 times greater than what the department collected from forfeitures in the 8 preceding years, a time when police budgets were growing.
In 2010, a commander in the West Covina police department wrote in Police Chief magazine about ideas from “a group of experts” for new ways to generate revenue, including through increasing all fines by 50 percent. He described two new “ordinances and programs” the department had implemented to generate new revenue: a new fine for party noise running up to $500 and a $1,000 fine on parents for juvenile graffiti.
Ferguson’s reliance on fines for revenue, during a period of regional financial stress, resulted in the city collecting 80% more fines between 2011 and 2013, by which point it was raising 20% of its budget through fines and forfeitures. Before the killing of Michael Brown, they anticipated that they would collect an extra million dollars in 2014 through police activity, raising a total of 25% of the city budget through fines.
Cities and their police departments may see increasing their dependence fines as a viable strategy for funding the government. However, the cost of running a revenue generation scheme through the criminal justice system is that things can very quickly get bad for the people who are required to pay for it. Municipalities can compound the financial hazard for the people who are fined by contracting with private probation collectors, who are allowed to add additional, legally-enforceable fees and interest to the amount that the court originally required.
To get details about how revenue-raising policing is working specifically, we need reporters to continue to dig into details and governments to respond to public records requests. Transparency and accountability must go together. In the meantime, the rest of us do have some public data sources which we can use to begin to answer the question.