Public comments on city open data policies focus on governance, uses and privacy
Editor’s Note: Public feedback on draft policies using online platforms is a useful complement to more traditional methods of rulemaking offline. This is the first post in a three-part series on analyzing public participation for draft open data policies on online forums. We will publish the next installments of the series later this week.
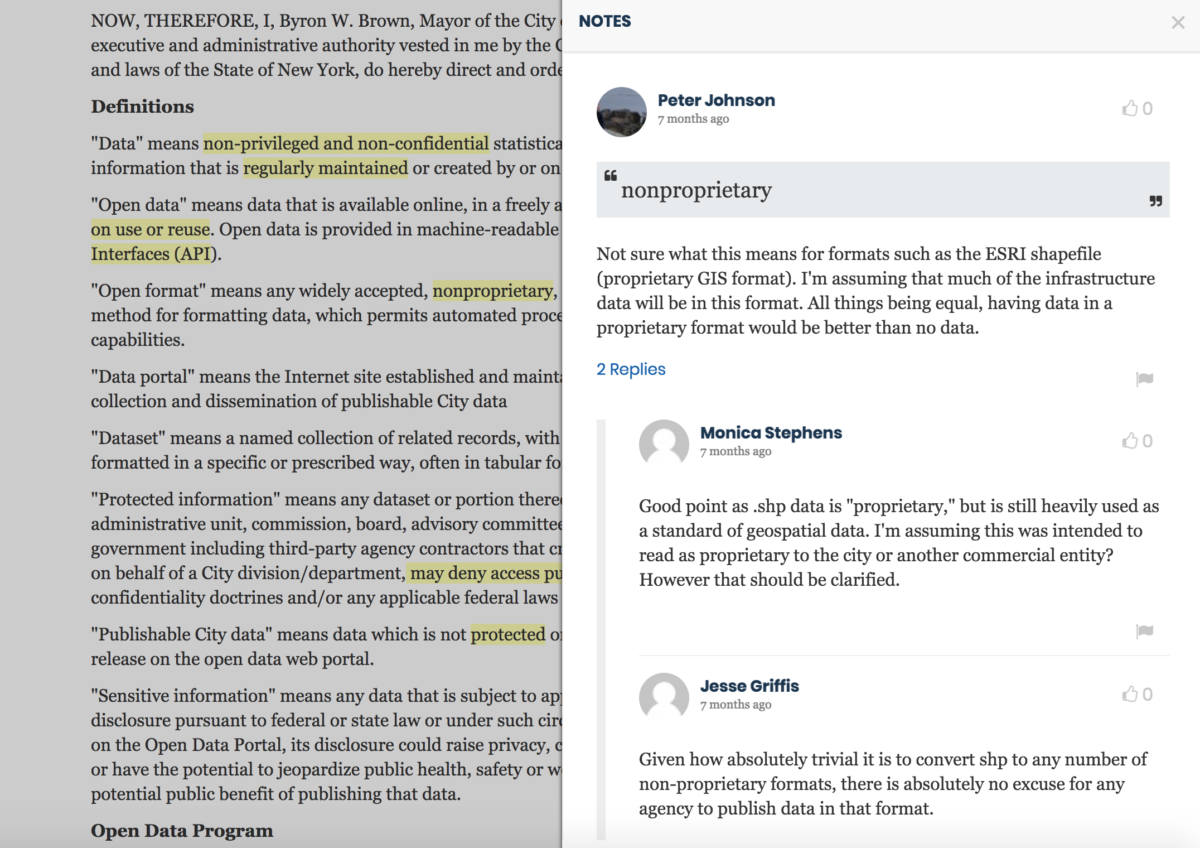
To understand how the public was interacting with municipal governments asking for comments on open data policies, we analyzed public comments on the drafts shared on the OpenGov Foundation’s Madison platform by nine cities around the United States.
Specifically, we examined the public comments on open data policies in Buffalo, Durham, Tyler, Glendale, Nashville, Syracuse, San Francisco, Naperville and the Bay Area Rapid Transit system, which added up to a total of 164 comments from 65 users. While the sample size of comments is admittedly small, we hope these posts will bring useful general insights. You can check our analysis on Github.
The Madison platform allows users to quote a specific section of a policy in their comment. The platform also allows users to pool together all the words in quoted policy text and sort the words by how often they appear. We realized this was a way to see what some of the most common comments are across policies.
To understand what topics people were most interested in discussing, we compared the frequency of quoted words to the frequency of all words that appear in policies. After we removed basic “stop words,” like “is” and “the,” as well as commonly recurring words like “open” and “data,” we found the following words were used the most often in quotes, compared to all policy text.
The table below ranks words by this ratio:
| Word | Freq. in quoted text | Freq. in policy text | Ratio | |
|---|---|---|---|---|
| 1 | governance | 5 | 2 | 2.50 |
| 2 | committee | 5 | 6 | 0.83 |
| 3 | city | 19 | 28 | 0.68 |
| 4 | participation | 5 | 11 | 0.45 |
| 5 | agency | 5 | 12 | 0.42 |
| 6 | publishable | 4 | 11 | 0.36 |
| 7 | ensure | 5 | 16 | 0.31 |
| 8 | protected | 6 | 20 | 0.30 |
| 9 | new | 5 | 17 | 0.29 |
| 10 | sensitive | 6 | 22 | 0.27 |
| 11 | dataset | 5 | 19 | 0.26 |
| 12 | open | 27 | 114 | 0.24 |
| 13 | datasets | 11 | 54 | 0.20 |
| 14 | publish | 4 | 20 | 0.20 |
| 15 | policy | 6 | 31 | 0.19 |
| 16 | published | 8 | 47 | 0.17 |
| 17 | data | 49 | 307 | 0.16 |
| 18 | public | 20 | 135 | 0.15 |
| 19 | including | 5 | 36 | 0.14 |
| 20 | information | 14 | 120 | 0.12 |
In graphical form, the data looks like this:
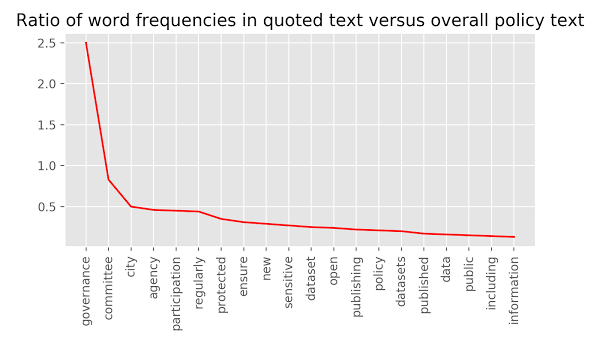
The topics that generated most interest are governance, committees, privacy and sensitive data, participation, frequency of data updates, and restrictions on use.
People who quoted “governance” and “committees” discussed issues such as how an Open Data Governance Committee will be formed, who would act as the liaison between the Committee and residents, and the need to make minutes of the committee meetings available.
People who made comments related to privacy and public participation said that they wanted more opportunities to provide feedback to open data programs, user-friendly visualizations for data sets, and better mechanisms in place to protect confidential data.
We also compared the frequency of words in comments to the frequency of words in policies. In the following table, we show which words were most often used in comments versus policy text.
| Word | Freq. in comment text | Freq. in policy text | Ratio | |
|---|---|---|---|---|
| 1 | governance | 15 | 2 | 7.50 |
| 2 | document | 21 | 3 | 7.00 |
| 3 | committee | 19 | 6 | 3.17 |
| 4 | city | 84 | 28 | 3.00 |
| 5 | support | 20 | 7 | 2.86 |
| 6 | community | 20 | 8 | 2.50 |
| 7 | policy | 57 | 31 | 1.84 |
| 8 | transparency | 22 | 13 | 1.69 |
| 9 | process | 26 | 17 | 1.53 |
| 10 | requests | 18 | 15 | 1.20 |
| 11 | government | 31 | 28 | 1.11 |
| 12 | open | 101 | 114 | 0.89 |
| 13 | data | 212 | 307 | 0.69 |
| 14 | include | 19 | 29 | 0.66 |
| 15 | access | 17 | 32 | 0.53 |
| 16 | public | 60 | 135 | 0.44 |
| 17 | portal | 16 | 38 | 0.42 |
| 18 | information | 44 | 120 | 0.37 |
Here, we can see many similar themes to the last point, especially regarding interest in governance. The addition of words like “good” and “support” indicate commenters were expressing their support for open data policies.
“Transparency” and “government” suggests enthusiasm regarding the role of open data in making government transparent.
This is not a perfect methodology to analyze popular open data policy topics. We cannot generalize the findings to a large sample of open data users nor an entire city population. The small sample size also likely reflects the needs and desires of technologists and small, engaged groups within broader communities.
As we stated earlier, however, our analysis does provide insights about what topics generate the most discussion within this subset and cities may find it the results useful for meaningfully engaging with residents. For instance, cities can incorporate more privacy principles to mitigate the risks of publishing unredacted data sets that could lead to harms within a community.
Cities can also use this analysis to inform how they craft open data policies. For example, city officials can explore ways to increase public participation in collecting public comments on open data policies. Conducting on-the-ground surveys, speaking with community members at town halls, and using social media can all help spread the word, encouraging a wider diversity of public comment on draft policies.
Whatever city officials decide to do, demonstrating that they are actively listening to community members’ feedback will improve trust between residents and their governments.