Untangling the webs of tax lobbying
It’s tax day today, and while Americans all over the country are scrambling to pay what they owe, in Washington there is a different kind of hustle taking place. Thousands of lobbyists are busily working to make sure that their more than 2,000 client organizations can pay a little less in taxes. Some want a new tax credit passed. In this year that threatened comprehensive tax reform, many are focused on protecting existing loopholes, credits, and exemptions.
To understand the vast and busy world of Washington tax lobbying, a new Sunlight Foundation analysis and visualization has mapped out the networks of tax lobbying from the 112th Congress (2011-2012), which should also be a pretty good guide to what lobbying in the 113th Congress will look like. Our interactive component lets you follow the industries and issues that you care most about.
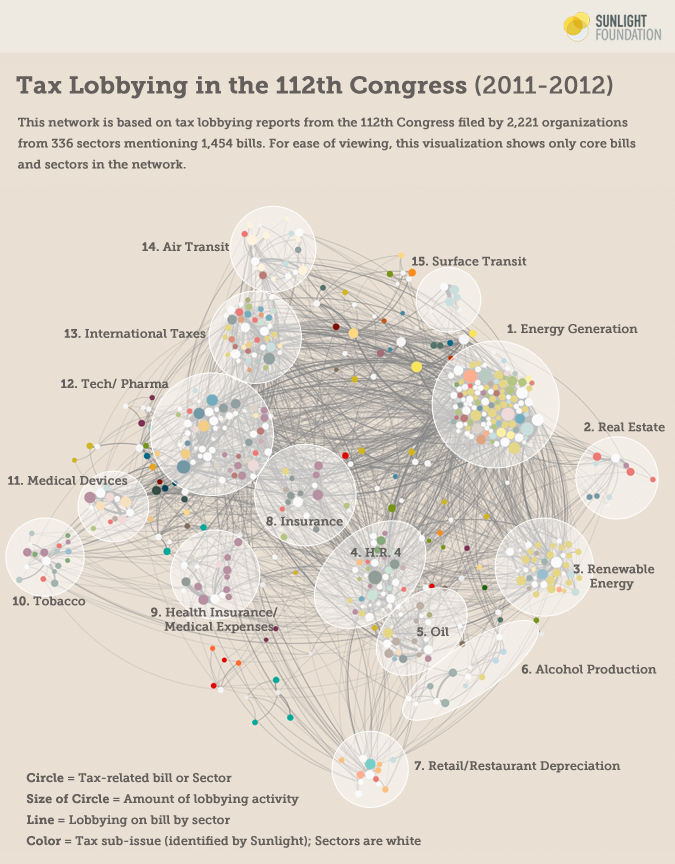 Graphic by Alexander Furnas and Amy Cesal. Click to explore the network interactively.
The visualization draws on the complete record of tax lobbying in the 112th Congress. For those keeping score at home, that covers:
- $773 million in reported lobbying spending
- 1,454 bills
- 2,221 organizations
Among all organizations actively lobbying in Washington during the last Congress, 16 percent lobbied on at least one tax issue. Similarly, 16.5 percent of all bills introduced showed up in lobbying reports as having a tax component. Finally, almost half (46 percent) of all registered lobbyists lobbied on at least one tax issue in the 112th Congress. In Washington, tax lobbying is big, big business.
The issues range from very niche tweaks to the tax code (see our accompanying story on 10 niche tax bills introduced in the 112th Congress) to more wide-ranging overhauls. While comprehensive tax reform lingered in the background in the 112th Congress, it did not gain much momentum. The vast majority of the successful legislative action on taxes took place around making sure a mess of “sweeteners” were included in the fiscal cliff bill that passed on January 1, 2013
Our visualization of the vast network of tax lobbying clearly shows clusters emerging around different sectors of the economy. We detect at least 15 distinct lobbying clusters. The densest thickets of activity center around: electricity generation; renewable energy; finance; and the high-tech industry.
The visualized tax lobbying network highlights a few things.
1) Multiple sectors are active in multiple tax- related issues, with many overlapping interests.
2) Even on an issue as complex as taxes, distinct clusters of activity do emerge. Here we count 15 (as compared to only six in our recent visualization of immigration lobbying).
3) Some clusters are bigger than others. There are several niche issues, of interest to only one or a handful of sectors. But even these are not entirely isolated in the network.
What does this mean for reform?
It means it’s going to be difficult to simplify the tax code. There are few obvious or easy places for comprehensive tax reform to start. Lobbyists representing pretty much the entire economy are well entrenched and prepared to defend a dense thicket of interlocking interests to protect favored loopholes, credits and other tax favors. Their attention is both wide and deep.
An overview of the clusters
Cluster 1, Energy Generation, the busiest cluster, is a somewhat motley mix of interests, but it is anchored most notably in heavy lobbying activity by gas & electric utilities, and electric power utilities. These energy utility sectors have substantial interest in legislation affecting everything from climate change to the withholding tax. The majority of bills in this group belong to the energy related sub-issues (e.g. renewable energy, hybrid/electric vehicles, alternative fuels and fuel standards), denoted in mustard yellow. This cluster also pulls in numerous industries that do not focus as intensely on tax issues, but lobby on similar bills as the electric utilities.
Cluster 2, Real Estate, moving clockwise, is a smaller cluster of real estate developers, who dominate lobbying on a handful of bills primarily dealing with bank lending and housing. In particular, the real estate industry lobbied extensively on both the House and Senate versions of the Real Estate Investment and Jobs Act of 2011, a niche bill which would have raised tax exemptions for foreign investment in real estate trust stock.
Cluster 3, Renewable Energy is another busy cluster dominated by the alternative energy sector, lobbying on bills related to ethanol subsidies, renewable energy subsidies, biofuels, and manufacturing.
Cluster 4, H.R. 4 is a cluster centered around a piece of legislation, the “Small Business Paperwork Mandate Elimination Act of 2011” which repealed certain 1099 reporting requirements mandated by President Barack Obama’s health care law. Dozens of sectors lobbied on the bill, most prominently, farm organizations and cooperatives, and milk and dairy producers. The president signed it into law two years ago this week, on April 14, 2011.
Cluster 5, Oil is dominated by the big oil companies, lobbying mostly to defend against various bills to end subsidies for domestic oil production, as well as some activity on international taxation and alternative fuels.
Cluster 6, Alcohol Production is a looser cluster of lobbying by the beer, wine, and distilled spirits industry, with one bill looming particularly large: the “Small Brewer Reinvestment and Expanding Workforce Act or the Small BREW Act,” which would “amend the Internal Revenue Code to reduce the rate of the excise tax on beer produced within or imported into the United States for brewers who produce not more than 6 million barrels of beer a year.” The bill never made it out of committee in the last Congress but Rep. Jim Gerlach, R-Pa., has reintroduced it this year.
Cluster 7, Retail/Restaurant Depreciation centers around lobbying by restaurants and retail companies on a provision that would allow them to recover costs of improvements to their properties more quickly. The bill has not become law.
Cluster 8, Insurance largely centers around insurance industry lobbying to change or repeal various provisions of the health care law, some of which were successful and others not.
Cluster 9, Health Insurance/Medical Expenses focuses on lobbying by health insurers and drug stores on tax treatment of medical expenses, with some general health care reform bills in the mix as well.
Cluster 10, Tobacco centers around tobacco companies’ lobbying, mostly on children’s health bills, and healthcare reform legislation.
Cluster 11, Medical Devices shows industry lobbying on bills dealing with taxation of medical devices and medical expenses.
Cluster 12, Tech/ Pharma puts computer and software manufacturers and the pharmaceutical industry at the center of lobbying around tax credits for research and development and the treatment of foreign earnings.
Cluster 13, International Taxes is a somewhat more mixed cluster, putting life insurance companies alongside industrial and commercial equipment manufacturers in lobbying heavily around some bills dealing with international taxation issues. The most prominent bill in the cluster, H.R. 749, which died in committee, would have made permanent an “exemption (which excludes such income from the shareholder’s foreign personal holding company income) for active financing (insurance, banking, financing, or similar businesses) income earned on business operations overseas.” This esoteric provision, while difficult to decode, meant big money and big lobbying for the covered industries.
Cluster 14, Air Transit shows a smaller network of airline industry companies lobbying around bills that address the taxation of air travel, the Federal Aviation Administration, and transportation infrastructure.
Cluster 15, Surface Transit, which completes the clockwise circle, covers railroad lobbying primarily on two linked bills: S. 672 / H.R.721 the “Short Line Railroad Rehabilitation and Investment Act of 2011” The bills were bottled up in committees last year but have been reintroduced in this session of Congress by Sen. Jay Rockefeller, D-W.Va., and Rep. Lynn Jenkins, R-Kansas.
Who Lobbies the Most?
Another way to look at tax lobbying is to investigate which sectors have been most active, and on which issues. We used language clustering to break 1,454 bills into 62 distinct issue clusters (for more on how we did this, see our methodology section at the end of the post). Our measure here is lobbying reports, by which we mean the total number of quarterly lobbying reports filed in the 112th Congress that mention tax lobbying. We also show the top issues, reporting the number of lobbying reports mentioning bills falling into the specific categories.
Table. 25 most active sectors, by bill mentions
| Sector | Lobbying Reports | Top Issue | Issue #2 |
|---|---|---|---|
| Gas & Electric Utilities | 391 | Hybrid Electric Vehicles, 75 | Veterans, 33 |
| Electric Power utilities | 324 | Hybrid Electric Vehicles, 46 | Witholding Tax, 36 |
| Alternate energy production & services | 282 | Ethanol, 43 | Fuel Standards, 41 |
| Telephone utilities | 230 | Misc. Tax Credits, 18 | Bush Tax Cuts, 17 |
| Insurance companies, brokers & agents | 194 | Insurance, 37 | Comprehensive Tax Bills, 16 |
| Medical supplies manufacturing & sales | 179 | Medical Devices, 50 | Discretionary Funding Cuts, 40 |
| Civil servant/public employee | 173 | Bond financing, 9 | Veterans, 9 |
| Security brokers & investment companies | 162 | International Taxation, 13 | Bush Tax Cuts, 11 |
| Cable & satellite TV production & distribution | 151 | Bonus Depreciation, 23 | Comprehensive Tax Bills, 16 |
| Life insurance | 146 | Bush Tax Cuts, 14 | Retirement Savings, 14 |
| Accident & health insurance | 145 | Healthcare reform, 41 | Insurance, 29 |
| Auto manufacturers | 141 | Hybrid Electric Vehicles, 45 | Bonus Depreciation, 30 |
| Industrial/commercial equipment & materials | 139 | Hybrid Electric Vehicles, 28 | International Taxation, 20 |
| Restaurants & drinking establishments | 133 | Targeted Depreciation, 27 | Personal Tax Deductions, 18 |
| Major (multinational) oil & gas producers | 132 | Ending “Big Oil” Tax Credits, 42 | Comprehensive Tax Bills, 17 |
| Tobacco & Tobacco products | 130 | Misc. Tax Credits, 28 | Food and Drug, 20 |
| Computer manufacture & services | 130 | Research Tax Credits, 24 | International Taxation, 18 |
| Farm organizations & cooperatives | 129 | Insurance, 24 | Estate Tax, 21 |
| Pharmaceutical manufacturing | 128 | Research Tax Credits, 39 | Medical expenses, 13 |
| Computer software | 123 | Foreign Earnings, 39 | Research Tax Credits, 25 |
| Real Estate developers & subdividers | 119 | Community Bank Lending, 30 | Surface Transit, 18 |
| Airlines | 115 | Air Transportation, 45 | Comprehensive Tax Bills, 9 |
| Independent oil & gas producers | 105 | Ending Big Oil Tax Credits, 38 | International Taxation, 14 |
| Independent power generation & cogeneration | 104 | Renewable Energy, 21 | Misc. Tax Credits, 13 |
| Fiscal & tax policy | 100 | Estate Tax, 9 | Patents/Innovation, 7 |
We can see that on tax lobbying, energy industries are most active. The gas & electric utilities industry tops the list, with 391 lobbying reports mentioning taxes during 2011-2012, followed closely by electric power utilities, at 324 lobbying reports. Both are predominantly interested in bills focused on the tax treatment of with hybrid and electric vehicle.
In third place, we find the alternative energy industry, with 282 lobbying reports and a primary interest in ethanol, fuel standards, and renewable energy issues. The alternative energy industry lobbied very heavily to make sure that its tax credits were extended in the fiscal cliff compromise.
It is worth noting that of the top 25 sectors registering the most activity, only two (civil servants/public employees, fiscal & tax policy groups) are not corporate sectors. These data reveal just how much tax lobbying is done on behalf of corporate interests – nearly all of it. While there are a few groups that advocate for taxpayers generally, almost all of the lobbying on taxes is on behalf of corporations looking for their own targeted benefits.
Surely, more detailed investigations into the lobbying strategies and wish lists of each of these sectors would yield many valuable insights into how special interests shape our tax code, but that is beyond the purview of this post. Our goal is merely to provide an overview, with the hopes that others will be inspired to dig deeper using the map and tools we’ve provided.
Does All This Lobbying Matter?
A year and a half ago, Sunlight looked at which Fortune 100 companies had lobbied on the most tax bills between 2008 and 2010. We found that the ten 10Fortune 100 companies that lobbied on 50 or more bills since 2008 paid an average effective tax rate of 17.1 percent in 2010. The ten companies that lobbied on between 25 and 49 bills paid an average effective tax rate of 18.0 percent. The remaining publicly-traded companies paid an average effective tax rate of 26.0 percent. The companies that lobbied on the most tax bills also have seen their tax rates decline the most since 2007.
Last April, Sunlight looked at the largest 200 companies who had spent the most money on lobbying overall. Of the eight companies that spent the most on federal lobbying between 2007 and 2009, seven decreased their overall tax rate between 2007 and 2010. And six of the Big Eight enjoyed a decrease of at least seven percentage points.
To be sure, all this correlation does not necessarily prove causation. But it strongly suggests it. The most comprehensive academic analysis of this question, published in the American Journal of Political science, finds that “Firms that spend more on lobbying in a given year pay lower effective tax rates in the next year. Increasing registered lobbying expenditures by 1 percent appears to lower effective tax rates by somewhere in the range of 0.5 to 1.6 percentage points for the average firm that lobbies.”
According to a 2005 report from the President’s Advisory Panel on Federal Tax Reform: “Since the 1986 tax reform bill passed, there have been nearly 15,000 changes to the tax code – equal to more than two changes a day. Each one of these changes had a sponsor, and each had a rationale to defend it. Each one was passed by Congress and signed into law.” In 2011, the IRS’s own ombudsman estimated the length of the U.S. tax code to be 3.8 million words – or about 6 ½ times the length of the famous Russian novel, War and Peace, for those reading at home.
When Congress makes changes to the tax code, it often does so in an omnibus way. The last mammoth tax bill to pass Congress, the 650-page 2004 American Jobs Creation Act, was dubbed the “No Lobbyist Left Behind Act” bill by the Economist. Those lobbyists and organizations that have been honing their arguments and solidifying their relationships in the previous Congress are likely to stand the best chance in the current Congress. Our visualizations provide an field guide for those who want to join the hunt.
Methodology
We began our analysis with all bills mentioned in lobbying disclosure forms under the category of taxes during the 112th Congress, and excluded bills for which no CRS summary could be found. The remaining bills were classified into sub-categories based on the text of their CRS produced summaries. To create these issue categories we used Latent Semantic Analysis (LSA), a form of natural language processing commonly used for text comparison, to measure the conceptual similarity of the bills. We then clustered the most similar bills together with hierarchical agglomerative clustering, using Ward’s linkage criteria. This process ensured that the most conceptually similar bills – at least according in the content of their CRS summaries – were treated as similar issues areas. For example, bills like S.214 Big Oil Bailout Prevention Unlimited Liability Act of 2011 and S.258 Close Big Oil Tax Loopholes Act were treated as the same sub-issue, ‘Ending “Big Oil” Tax Credits,’ under the umbrella of tax bills. We manually labeled the resulting 62 clusters based on their contents. To serve our purpose of highlighting niche sector interests, we removed the clusters that were filled with comprehensive reform and omnibus budget acts, as well as several heterogeneous clusters which were not informative.
We then applied the labels (denoted by color) from this clustering to the bills in the network representation of lobbying activity. To highlight similarities, some closely related sub-issues (e.g. energy credits, health, and financial services) have been assigned the same color. The nodes in this bipartite network represent specific bills and the sectors (based on Center for Responsive Politics sector classifications) that lobbied on them. The weighted directed edges are based on the number of lobbying reports filed by the given sector that mentioned the given bill. To highlight significant activity, we filtered the network visualization to show only the subgraph with a k-core of 2. The graph layout was done using the Gephi implementation of the OpenOrd algorithm, which employs aggressive edge-cutting to promote clustering.
Update: The post has been updated to reflect the fact that our original estimate of 6,503 lobbyists was likely an over-inflated estimate, and so we have removed references to this number. Due to the nature of the data and the messiness of lobbying reporting, it is currently impossible to pinpoint a 100% accurate count of the total number of lobbyists engaged on a particular issue. The 6,503 lobbyists in the original post represents the number of lobbyists whose names are mentioned on lobbying reports that also mention taxes, and so represents an upper bound of the number of lobbyists that could possibly be engaged in tax lobbying.
Data Sources:
InfluenceExplorer.com. Opensecrets.org