The Landscape of Municipal Zoning Data
Zoning impacts the most physical elements of communities and impacts people’s daily lives. When it comes to being transparent about the zoning process and its outcomes, many local governments are posting information — one way or another — on their websites. It’s a varied landscape, but it is worth assessing to see where there might be room for improvement.
WHAT WE TALK ABOUT WHEN WE TALK ABOUT ZONING
It’s not surprising, in a way, that so many local governments choose to proactively release various kinds of information related to zoning. Zoning regulations can impact everything from what can be built and where it can be built to how it can be built and more. How a lot is zoned doesn’t just determine whether that land can be used for commercial or residential purposes (or something else entirely) — it can also determine the very structure of buildings down to details like height and square footage. Zoning and planning ordinances can even impact how close certain kinds of buildings may be to one another — schools and liquor stores are one example of a spatial relationship that is sometimes regulated. Zoning has an impact on many of the most concrete aspects of a municipality, and this makes it an issue that’s of interest to residents, business owners, developers, and many other groups. This means zoning can also be a prime target for people who want to game the system to obtain influence over this important aspect of cities.
 The zoning process generally consists of elected or appointed officials making decisions about how land can be used and the specifications of structures. It has a direct impact on the shape communities take. The zoning process, and what it controls, however, varies from place to place. That means it’s important for each municipality to be clear about what its process is so policymakers, residents, and businesses alike can all understand this powerful issue. For this look into the landscape of zoning data, we’re including information most directly related to the process and its outcomes. We’re not including other data that might be tied to land parcels, like data about tax breaks or special tax zones.
Not all zoning data is created equal, of course. Some cities simply release a list of the ordinances related to zoning, others release PDF maps of how land parcels are zoned, and some have interactive maps with layers of information. To have open zoning data, a municipality should have structured data available online that makes it easy for people to analyze and reuse — in addition to information that enables people to understand the zoning process.
The phrase “open data” is often used without an explanation of how something qualifies as fitting that definition. For zoning data to be open, it should be more than “open” in the sense that it gives people the license and permission to reuse it. It should also be structured in such a way that it is machine-readable, enabling easy reuse of the data by those who want to add context or put it into an application. Formats that would qualify as open and structured include JSON, CSV, and XML for databases, as well as formats that can carry zoning data in particular across various kinds of geographic information system (GIS) software, like shapefiles.
This isn’t to discount static files like PDFs entirely as something that can be helpful to post online. PDFs are primarily designed to preserve document structure across platforms and to be readable by humans. They might be useful, for example, for printing out maps of current zoning for a neighborhood and comparing it to maps of proposed zoning changes — something that could be handed out at a neighborhood meeting or zoning commission meeting. However, if you want zoning information to be consumable by mobile, web or desktop applications, using PDFs is less than desirable.
COVERING THE BASICS
While maps might be the first kind of zoning data that comes to mind, maps aren’t the only kind of information that matter when it comes to being open about zoning. Maps may provide an end-user experience, but they don’t shine a light on how things got to be the way they are. Zoning maps don’t usually provide answers to questions like: What is the zoning process for a specific municipality, since it can vary from city to city? What are the stipulations for how something is zoned in that city, and how can it be changed? What privileges or restrictions are handed out through the zoning process? Who oversees the zoning process? Where can people go to express support for, or concerns about, zoning changes?
Some cities proactively share information online that answers many of these process questions about their zoning. Arvada, CO, has a portal for its planning and zoning information that includes information about who oversees these processes, the current codes regulating the processes, and details about fees and applications, all in addition to an array of maps about zoning, planning, and land use. Madison, WI, has detailed guides about its zoning processes available from one page, too. Fort Worth, TX, has a single page dedicated to explicitly answering specific questions about zoning basics and linking to further resources.
Not all cities provide this basic layer of insight into how zoning happens, however. Some cities just post ordinances and some information about zoning commission meetings but don’t add much more context, leaving questions about important details like permit processes. In other cities, all of the process questions are answered online, but they’re not all grouped together in a way that’s easy to find or navigate.
THE NEXT STEPS
Answering the procedural questions related to zoning and planning provides an important layer of transparency. More layers of transparency come into the picture when cities also release maps that visualize how zoning works. Zoning maps range from the simple and static to the complex and interactive.
The most simple and static zoning maps often come in the form of PDF files or other image files, like JPG. Bethlehem, PA, and Chandler, AZ, for example, make their current zoning maps available as downloadable PDFs.
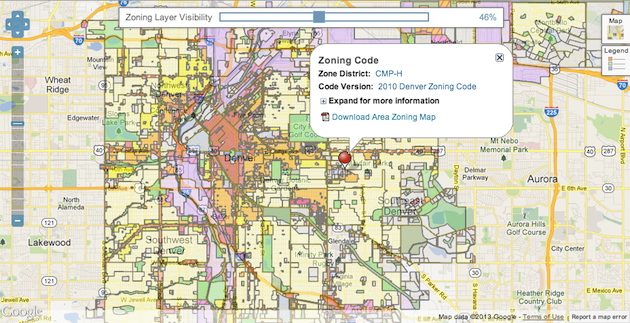
While it’s better to have PDFs than nothing at all, taking the next step and releasing more interactive zoning data interfaces enables analysis in a way that’s often not possible with static image files. Some cities, like Alexandria, VA, provide both static maps in PDF formats and maps with layered information. Alexandria’s GIS maps provide information in four layers: buildings, streets, metro tracks, and metro stops. Denver, CO, provides an interactive map on their website that allows users to see the zoning of specific parcels across the city, including details about zone districts, codes, and relevant ordinance numbers.
Map portals come with their own set of challenges for users trying to understand just what zoning regulations really mean in practice. Sometimes trying to make the maps able to show all the complex layers of zoning (or trying to make them too simplified) can cloud people’s ability to understand what it all means.
OPEN, STRUCTURED DATA FOR DOWNLOADS
Having a map portal doesn’t mean a city makes its zoning data available for download, either. Open, structured zoning data is actually available for download in a relatively small number of cities — and mostly in big cities. Cities that do allow for bulk download of their geospatial data include Chicago, Philadelphia, New York, and Washington, D.C. We had a hard time finding small cities that allow for bulk downloads of their geospatial data.
Small or rural cities aren’t exempt from having complex zoning processes and outcomes that should be made more transparent and could benefit from having bulk download. While bigger or more urban cities might typically have more area to zone or more kinds of zoning types related to residential and commercial purposes, small or rural cities sometimes have other kinds of zones (like agricultural) or their own special complexities. Releasing zoning information is something that’s needed across the different sizes and types of municipalities.
Bulk downloads of zoning data are important because they can can make it easier for users to see the two levels of zoning data that should be available: parcel-level data containing property boundaries and zoning statuses as well as zone-level data that groups together parcels with the same zones. Data that is available for download should also include clear metadata that can help reveal trends in the data and assist with organizational, archival, and data quality efforts.
Most cities are far from this level of transparency, however. So what’s to be done about zoning data? How can municipalities be open about the zoning process and what current zoning means?
***
Even those groups who work closely with zoning issues are aware of the complexities of this kind of data. The idea of trying to standardize this kind of data has sparked long conversations in the urban planning community about the benefits and challenges of such a move. It’s hard to define what would work well across so many different sizes of cities with such different needs and people to serve. How a local government approaches zoning can also be impacted by complex legal and regulatory relationships between states and localities, which is explored as part of this National Association of Counties report.
There are many resources from locally-focused groups exploring how zoning, and the processes that create it, might be made more accessible to the public. We’ve compiled some in our research.
Defining open zoning data is a complex task. It’s worth thinking about because it is a dataset that literally shapes the environment in which people live, work, and play. While there is complexity in zoning data, having better data would empower transparency and accountability in several ways: it would allow policymakers to better understand the impact of their decisions related to zoning, allow people to understand what they are (or are not) allowed to do, and provide accountability on the process itself, to name a few. We’ll explore these impacts of opening up zoning data further in an upcoming post.
Thanks to Kaitlin Devine, Steve Spiker, Andrew Salzberg, Lou Huang, Andrew Hill, Juan Pablo-Velez, and many others for contributing information to this post.
Photo of Madison, WI, by Flickr user Ann Althouse.
Screenshot from City of Denver GIS map.