The bigger the bank, the higher the complaint rate
The bigger the bank, the higher the rate of consumer complaints. That is the general pattern of a new Sunlight Foundation analysis of just-released consumer complaint data from the Consumer Financial Protection Bureau (CFPB).
The relationship is hardly surprising. The biggest banks consistently score the worst on surveys of customer satisfaction. The most recent survey found Bank of America with the lowest customer satisfaction rate. We find Bank of America to have the second highest rate of complaints, trailing only Capital One, a major issuer of credit cards. Capital One accounts for 21.3% (4,181 of 19,603) of credit card complaints in the CFPB data.
Whether you need an online calculator to work out how much you can borrow, how much you will have to pay each month or even to help you work out whether it’s worth making an overpayment; you can find lots of useful mortgage calculators here to help you. We even have a mortgage calculator designed to help you compare mortgage rates.
The data describe 90,000 complaints filed with the CFPB since December 2011 and cover five primary areas: consumer loans, mortgages, credit cards, student loans, and “bank account or service.”
Figure 1 plots the relationship between bank size (as measured by deposits) and the number of complaints per $1 billion in deposits. The dotted red line is a linear regression line that shows the underlying relationship: the bigger the bank, the higher the rate of consumer complaints.
Figure 1.
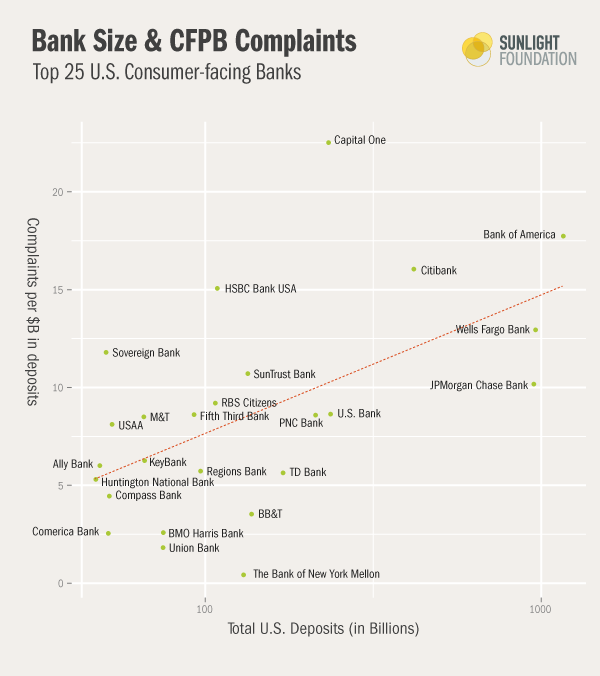
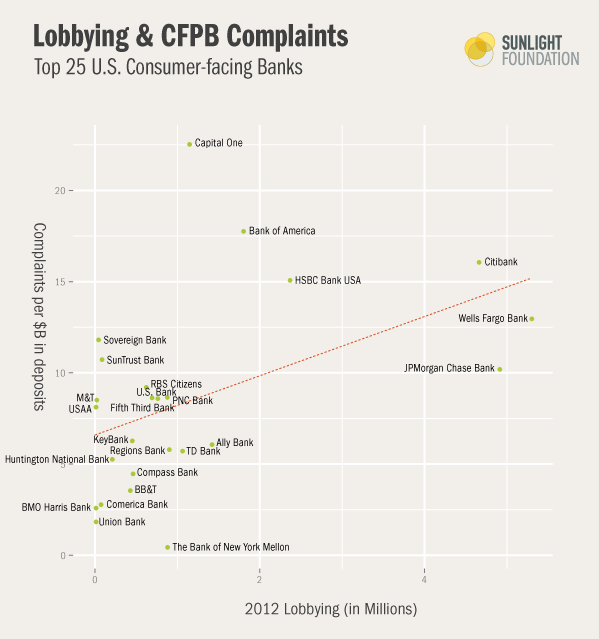
Figure 2 plots the relationship between 2012 federal lobbying spending and complaint rate. A similar relationship emerges, perhaps largely because the correlation between size and lobbying spending is high (Pearson’s correlation of 0.75) – as we would expect. The five banks with the highest number of complaints per billion dollars of deposits (Capitol One, Bank of America, Citibank, HSBC, and Wells Fargo), all topped one million dollars in reported lobbying expenditures in 2012.
Figure 2.
While there is no real causal story to tell between high lobbying expenditures and poor customer service, one easily could see both as representing a common arrogance of power – a sense that the big banks feel they can dictate the terms on which they would like to do business. It is worth noting that prior to the financial crisis, the bank lenders who lobbied the most in Washington also had the riskiest lending portfolios, according to an IMF paper.
Table 1 (below) shows the underlying data in tabular form.
Table 1. Top 25 consumer-facing banks, ranked by complaint rate
| Bank Name | Complaints Per Billion $ | Total Domestic Deposits (in billions) | Complaints | Branches | 2012 Lobbying |
|---|---|---|---|---|---|
| Capital One | 22.469 | $231.65 | 5205 | 962 | $1,135,000 |
| Bank of America | 17.690 | $1,157.07 | 20469 | 5601 | $1,790,000 |
| Citibank | 16.003 | $415.12 | 6643 | 1056 | $4,650,000 |
| HSBC Bank USA | 15.014 | $108.03 | 1622 | 302 | $2,356,000 |
| Wells Fargo Bank | 12.900 | $957.42 | 12351 | 6337 | $5,290,000 |
| Sovereign Bank | 11.743 | $50.41 | 592 | 721 | $30,000 |
| SunTrust Bank | 10.662 | $133.28 | 1421 | 1698 | $75,000 |
| JPMorgan Chase Bank | 10.129 | $946.30 | 9585 | 5695 | $4,900,000 |
| RBS Citizens/Citizens Bank of Penn. | 9.147 | $106.59 | 975 | 1418 | $610,000 |
| U.S. Bank | 8.592 | $234.98 | 2019 | 3140 | $866,600 |
| Fifth Third Bank | 8.567 | $92.09 | 789 | 1373 | $680,000 |
| PNC Bank | 8.535 | $211.85 | 1808 | 3066 | $750,000 |
| Manufacturers and Traders Trust Company | 8.449 | $65.33 | 552 | 764 | $10,000 |
| USAA Federal Savings Bank | 8.066 | $52.57 | 424 | 1 | 0 |
| KeyBank | 6.219 | $65.61 | 408 | 1061 | $442,250 |
| Ally Bank | 5.959 | $48.37 | 288 | 2 | $1,410,000 |
| Regions Bank | 5.682 | $96.28 | 547 | 1731 | $890,000 |
| TD Bank | 5.594 | $169.47 | 948 | 1334 | $1,050,000 |
| The Huntington National Bank | 5.254 | $47.01 | 247 | 932 | $197,000 |
| Compass Bank | 4.403 | $51.56 | 227 | 718 | $450,000 |
| Branch Banking and Trust Company | 3.485 | $136.57 | 476 | 1847 | $415,875 |
| BMO Harris Bank | 2.530 | $74.70 | 189 | 709 | 0 |
| Comerica Bank | 2.499 | $51.30 | 128 | 490 | 0 |
| Union Bank | 1.772 | $74.48 | 132 | 446 | 0 |
| The Bank of New York Mellon | 0.371 | $129.30 | 48 | 35 | $870,000 |
Conclusion
With renewed interest in breaking up the big banks in the U.S. Senate to address too-big-to-fail concerns, these data provide another potential justification: bigger banks appear to treat their customers worse. That they are also the biggest spenders on lobbying is hardly surprising. But it also speaks to a similar arrogance of power.
It is important here to thank Consumer Financial Protection Bureau for not only making this data public, but also for presenting it a clean, easy-to-use format. We at Sunlight spend plenty of time working with federal data that that is depressingly messy, where names and entities are rarely, if ever, standardized. The CFPB did a praiseworthy job of making sure these data were ready to use without any extra cleaning. We share the CFPB’s hope that many others will find new and creative uses for analyzing and visualizing these data.
Methodology
We limited our analysis group to the top 25 consumer-facing banks ranked by total domestic deposits. Because CFPB consumer complaint data deals with consumer complaints, we excluded top investment banks that do not have significant consumer-facing operations, like Goldman Sachs, Morgan Stanley, Charles Schwab and UBS. Data for total domestic deposits came from the FDIC and includes “all domestic office deposits, including demand deposits, money market deposits, other savings deposits and time deposits.” Financial Institutions often have complex parent/ subsidiary company relationships. When possible. we merged existing financial institutions that were owned by the same parent company and treated them as one bank. For example, we merged RBS Citizens and Citizens Bank of Pennsylvania, which are both parts of the Citizen Financial Group, which is, in turn, a wholly owned subsidiary of the Royal Bank of Scotland. We also merged Capital One and Capital One Bank, as well as FIA Card Services with its parent company Bank of America. The lobbying spending reported is for only 2012, which coincides roughly with the reporting period of the CFPB data. We did our best to match entities between lobbying clients and Banks in the FDIC and CFPB data.
Graphics by Amy Cesal.
Thanks to Alison Rowland and Jennifer Cheng for their help in producing this post.