The Impact of Opening Up Zoning Data
The content, format, and quality of the zoning information municipalities share varies widely. Posting this information online empowers policymakers to better understand the impact of their decisions and allows people to provide accountability on the process. Access to this information can also help people understand what they are or are not allowed to do — but zoning data, even in an open format, is not always easy to understand. Thankfully, having this data publicly available has also enabled applications and news stories that contextualize the information and show people just how zoning regulations and processes can impact them.
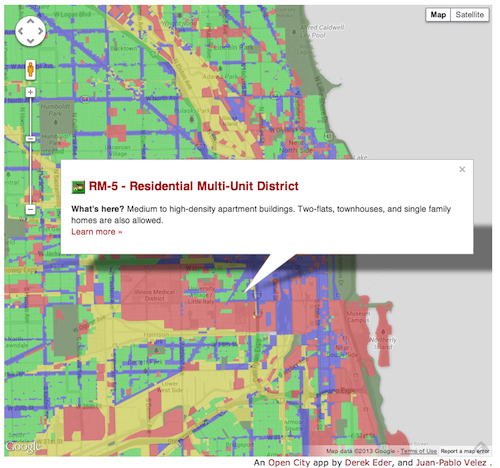
Take a look, for example, at Second City Zoning created by the folks at Open City Apps in Chicago, Illinois. This app breaks down complex zoning regulations into categories that would make sense to someone who’s not at all familiar with Chicago’s specific codes. Users can look at the city’s zoning by type (residential, commercial, or industrial) and by special purpose districts, such as planned development, transportation, parks, and open space. Hovering a computer mouse over any of these categories also reveals a short pop-up explanation of what that category means. Clicking on the interactive map allows users to see what exists on a certain section of land, ranging from parks and playgrounds to shopping centers and tall buildings. Visualizing zoning data in this way enables people to easily see what zoning regulations mean in practice, and it allows them to research how different zoning might lead to a changed landscape. Second City Zoning’s About section also has explanations related to the zoning processes and regulations, further empowering users to understand just what this complex dataset can mean in practice.
Second City Zoning isn’t the only example of how complex zoning information can be contextualized. Zoner is a mobile app that lets users calculate how much floor area they could build on certain properties in New York City based on zoning codes. Zonability uses zoning data and other information to create a profile of what could be done on properties for two cities in Texas (Austin and Round Rock). There are likely several more apps like these aimed at helping developers understand the potential for different pieces of real estate based on zoning information.
Like many other datasets, zoning information is often most powerful when it’s examined at its point of intersection with another dataset. In cities like Chicago, where zoning is an issue that attracts a significant amount of lobbying and money in efforts to influence decisions, looking at zoning data and lobbying data together can help discover powerful narratives about influence in politics — and how this system of influence can impact people’s daily lives. This is illustrated by news pieces like the Chicago Tribune’s eight-part investigation into the groups hoping to use money to influence city government’s zoning decisions. The series revealed how developers seem to benefit from campaign contributions to the city council members who make decisions about zoning: decisions that can make or break a developer’s chance for business. The app Chicago Lobbyists has also tracked the lobbyists who have tried to influence zoning regulations. Making this data available helps empower residents to see who might be trying to change regulations that could impact their neighborhood.
In an upcoming post, we’ll explore some of the steps that could be taken to further improve the release of municipal zoning data and lead to more reuse of the information in the form of apps, news stories, and more.
Screenshot from Second City Zoning